Water_stress_2019_WRI.png
Size of this preview:
800 × 351 pixels
.
Other resolutions:
320 × 140 pixels
|
640 × 281 pixels
|
1,425 × 625 pixels
.
Summary
| Description |
English:
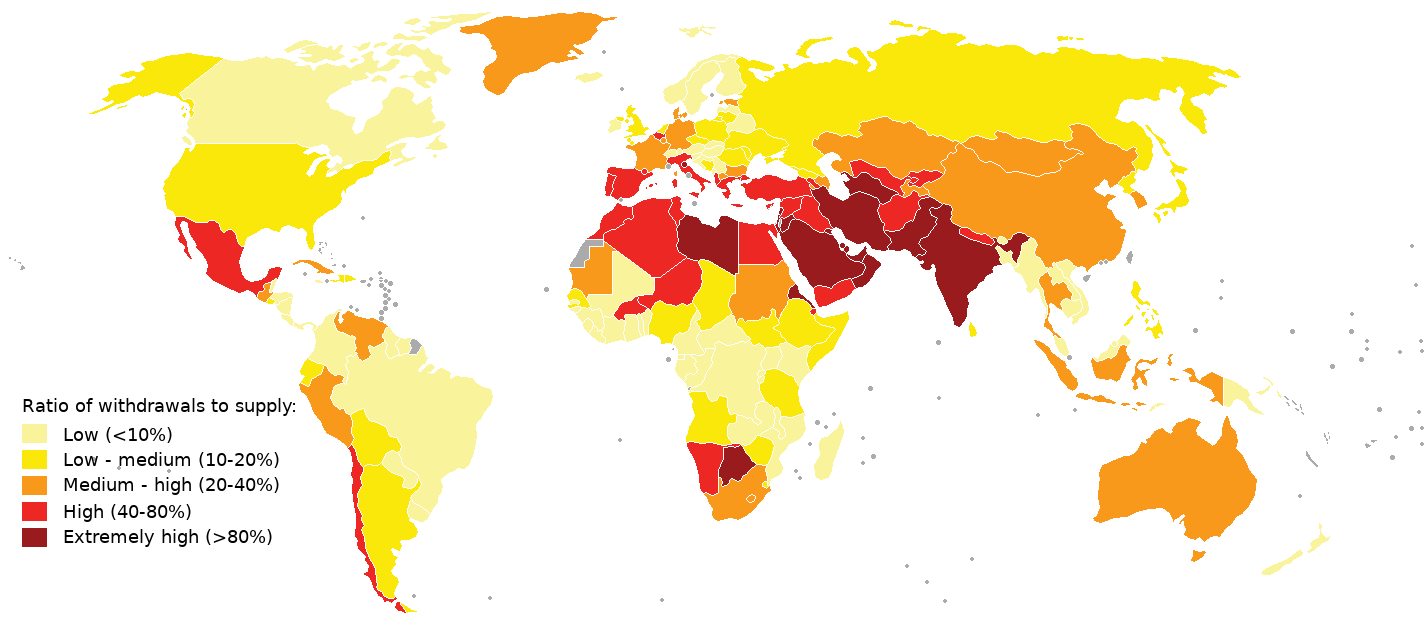
2019 water stress map.
Compiled using aqueduct 3.0 data from World Resources Institute See table "National Water Stress Rankings" at https://www.wri.org/blog/2019/08/17-countries-home-one-quarter-world-population-face-extremely-high-water-stress and https://www.wri.org/applications/aqueduct/country-rankings/ Legend was made similar as in an earlier WRI map (aqueduct 2.0), see https://www.wri.org/resources/data-sets/aqueduct-projected-water-stress-country-rankings What's colored in grey means no data available (i.e. western sahara, french guyana) |
| Date | |
| Source | Own work |
| Author | Genetics4good |
Licensing
I, the copyright holder of this work, hereby publish it under the following license:

|
Permission is granted to copy, distribute and/or modify this document under the terms of the GNU Free Documentation License , Version 1.2 or any later version published by the Free Software Foundation ; with no Invariant Sections, no Front-Cover Texts, and no Back-Cover Texts. A copy of the license is included in the section entitled GNU Free Documentation License . |