Temperature-relative_humidity_chart_-_PMV_method.png

Size of this preview:
707 × 599 pixels
.
Other resolutions:
283 × 240 pixels
|
566 × 480 pixels
|
906 × 768 pixels
|
1,246 × 1,056 pixels
.
Summary
| Description |
English:
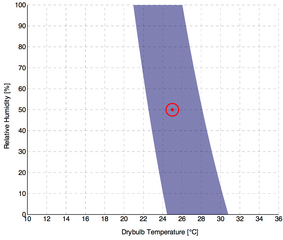
This chart represents the acceptable combination of air temperature and humidity values, according to the PMV/PPD method in the ASHRAE 55-2010 Standard. The representation is made on a temperature-relative humidity, instead of a standard psychrometric chart.
The comfort zone in blue represents the 90% of acceptability, which means the conditions between -0.5 and +0.5 PMV, or PPD < 10%.
|
| Date | |
| Source | CBE Thermal Comfort Tool for ASHRAE 55 (cbe.berkeley.edu/comforttool) |
| Author | Center for the Built Environment, University of California Berkeley |
Licensing
This file is licensed under the
Creative Commons
Attribution-Share Alike 3.0 Unported
license.
Attribution:
Center for the Built Environment, University of California Berkeley
-
You are free:
- to share – to copy, distribute and transmit the work
- to remix – to adapt the work
-
Under the following conditions:
- attribution – You must give appropriate credit, provide a link to the license, and indicate if changes were made. You may do so in any reasonable manner, but not in any way that suggests the licensor endorses you or your use.
- share alike – If you remix, transform, or build upon the material, you must distribute your contributions under the same or compatible license as the original.