SP_DensidadePopulacional.svg

Size of this PNG preview of this SVG file:
800 × 500 pixels
.
Other resolutions:
320 × 200 pixels
|
640 × 400 pixels
|
1,024 × 641 pixels
|
1,280 × 801 pixels
|
2,560 × 1,601 pixels
|
1,020 × 638 pixels
.
Summary
| Description |
Português:
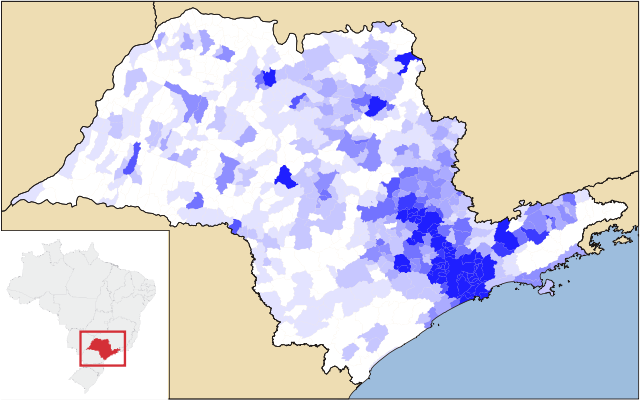
Mapa da densidade populacional do
estado de São Paulo
.
0-25 hab/km²
25-50 hab/km²
50-100 hab/km²
100-150 hab/km²
150-200 hab/km²
200-300 hab/km²
300-400 hab/km²
400-500 hab/km²
> 500 hab/km²
|
| Date | |
| Source | File:SaoPaulo DensidadePopulacional.svg - Lucas Schnorr |
| Author |
by
Marcos Elias de Oliveira Júnior
talk!
+
( contact here ) |
Contém 9 faixas de densidade população (por quilômetro quadrado): 25 50 100 150 200 300 400 500 1000 A área dos municípios utilizada foi aquela definida pela Resolução 05 de 10 de Outubro de 2002 do Instituto Brasileiro de Geografia e Estatística (IBGE). A população dos municípios utilizada foi obtida a partir da Contagem 2007 do IBGE, publicada no Diário Oficial da União (DOU - Brasil) em 10 de Outubro de 2007, indicando a população residente nos municípios em 01/Abril/2007.
Licensing
This file is licensed under the
Creative Commons
Attribution-Share Alike 3.0 Unported
license.
-
You are free:
- to share – to copy, distribute and transmit the work
- to remix – to adapt the work
-
Under the following conditions:
- attribution – You must give appropriate credit, provide a link to the license, and indicate if changes were made. You may do so in any reasonable manner, but not in any way that suggests the licensor endorses you or your use.
- share alike – If you remix, transform, or build upon the material, you must distribute your contributions under the same or compatible license as the original.