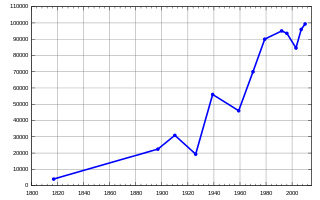
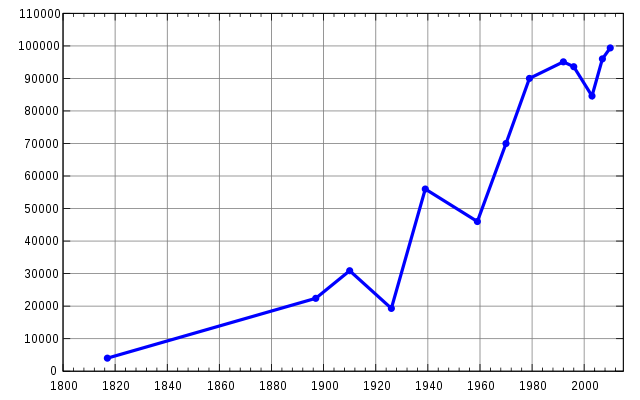
Pushkin_population_history.svg

Size of this PNG preview of this SVG file:
800 × 500 pixels
.
Other resolutions:
320 × 200 pixels
|
640 × 400 pixels
|
1,024 × 640 pixels
|
1,280 × 800 pixels
|
2,560 × 1,600 pixels
.
A chart a ministry of gender,labour and social development will use to sensitize the particular group of working class of Ugandans
Summary
| Description |
Русский:
Население Пушкина
|
| Date | |
| Source | Own work |
| Author |
Licensing
I, the copyright holder of this work, hereby publish it under the following licenses:
This file is licensed under the
Creative Commons
Attribution-Share Alike 3.0 Unported
license.
-
You are free:
- to share – to copy, distribute and transmit the work
- to remix – to adapt the work
-
Under the following conditions:
- attribution – You must give appropriate credit, provide a link to the license, and indicate if changes were made. You may do so in any reasonable manner, but not in any way that suggests the licensor endorses you or your use.
- share alike – If you remix, transform, or build upon the material, you must distribute your contributions under the same or compatible license as the original.

|
Permission is granted to copy, distribute and/or modify this document under the terms of the GNU Free Documentation License , Version 1.2 or any later version published by the Free Software Foundation ; with no Invariant Sections, no Front-Cover Texts, and no Back-Cover Texts. A copy of the license is included in the section entitled GNU Free Documentation License . |
You may select the license of your choice.
Gnuplot
Version 4.4 patchlevel 0-rc1
last modified November 2009
System: MS-Windows 32 bit
File «Pushkin population history.plt»
set encoding iso_8859_1
set terminal svg size 800,500
set output 'Pushkin population history.svg'

set xrange ["1800":"2015"]
set yrange [0:110000]
set format x "%g"
set format y "%g"
set grid
set xtics autofreq 20
set mxtics 5
set ytics autofreq 10000
set mytics 0

plot 'Pushkin population history.dat' using 1:2 notitle with linespoints lt 3 lw 4 pt 7
File «Pushkin population history.dat»
1817    4000
1897    22400
1910    30880
1926    19300
1939    56000
1959    46000
1970    70000
1979    90000
1992    100000
1996    136000
2003    197356
2007    228438
2010    250000
2011    251400