Phase_diagram_of_solid_oxygen.svg

Size of this PNG preview of this SVG file:
630 × 454 pixels
.
Other resolutions:
320 × 231 pixels
|
640 × 461 pixels
|
1,024 × 738 pixels
|
1,280 × 922 pixels
|
2,560 × 1,845 pixels
.
Summary
| Description |
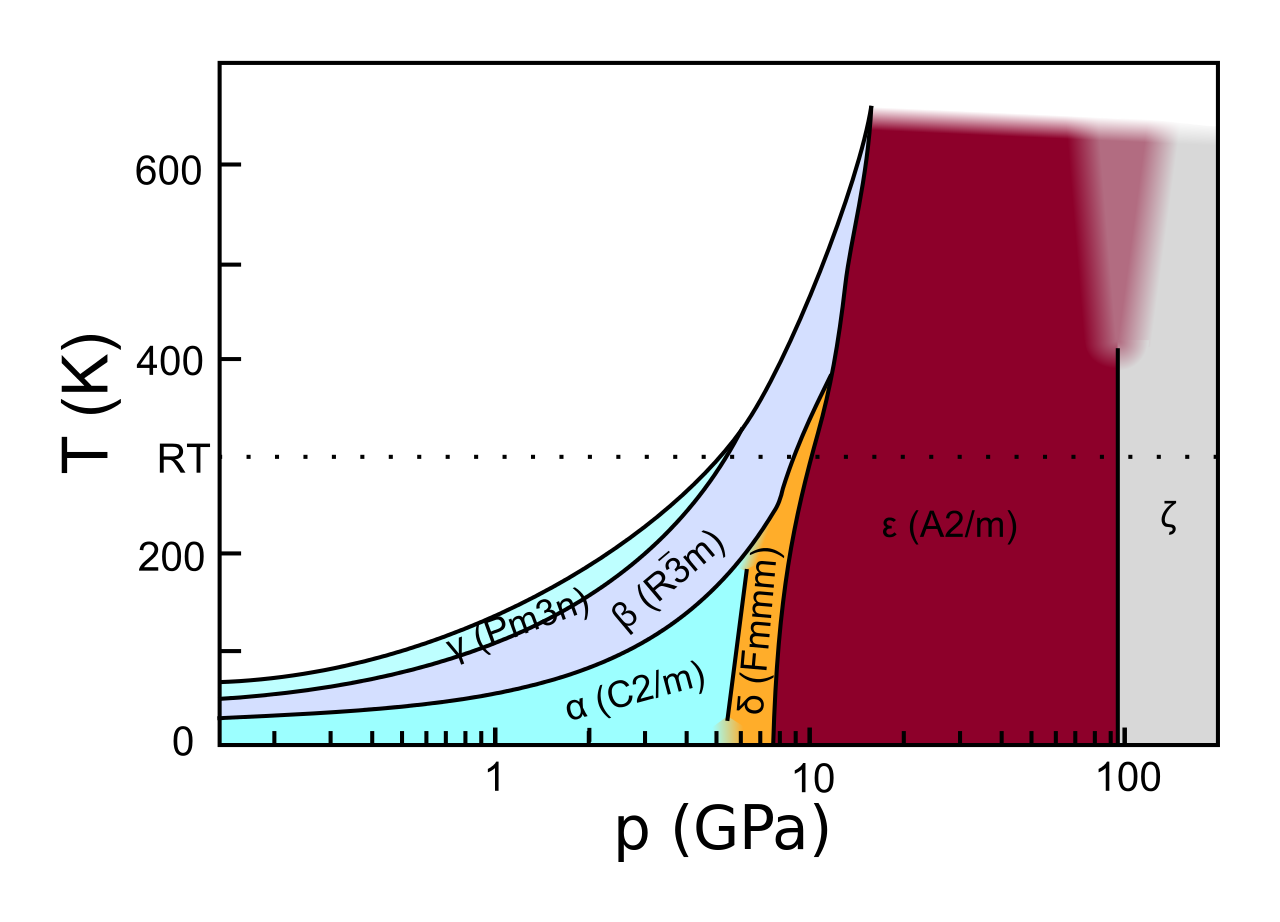
English:
Phase diagram of
solid oxygen
.
RT
=room temperature; white field on the left means the oxygen is a fluid.
Polski:
Diagram fazowy
stałego tlenu
.
RT
=temperatura pokojowa; biała pole po lewej stronie wykresu oznacza tlen w stanie ciekłym.
|
| Date | |
| Source | Own work , based on: Yu.A. Freiman, H.J. Jodl: Solid oxygen. „Physics Reports”. 401 (1–4), p. 1–228, 2004. doi:10.1016/j.physrep.2004.06.002 |
| Author | Kaligula |
Licensing
I, the copyright holder of this work, hereby publish it under the following license:
This file is licensed under the
Creative Commons
Attribution-Share Alike 3.0 Unported
license.
-
You are free:
- to share – to copy, distribute and transmit the work
- to remix – to adapt the work
-
Under the following conditions:
- attribution – You must give appropriate credit, provide a link to the license, and indicate if changes were made. You may do so in any reasonable manner, but not in any way that suggests the licensor endorses you or your use.
- share alike – If you remix, transform, or build upon the material, you must distribute your contributions under the same or compatible license as the original.