Paid_employees_by_us_sector_1997-2007.svg

Size of this PNG preview of this SVG file:
800 × 324 pixels
.
Other resolutions:
320 × 130 pixels
|
640 × 259 pixels
|
1,024 × 415 pixels
|
1,280 × 518 pixels
|
2,560 × 1,036 pixels
|
1,361 × 551 pixels
.
| Description |
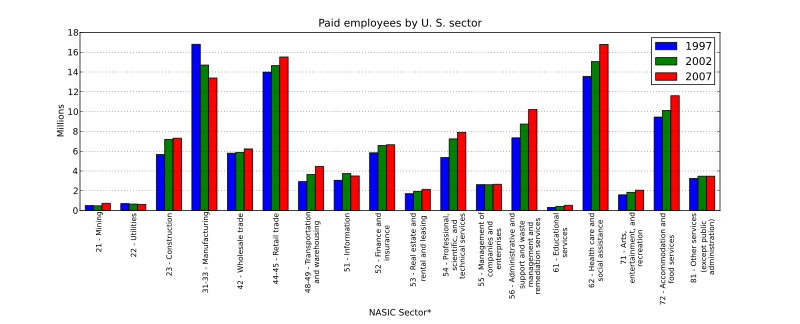
English:
The economic sectors of the United States of America in the years 1997, 2002, and 2007 listed by number of paid employees.
|
||
| Date | 14:48, 4 November 2012 (UTC) | ||
| Source | self-made using matplotlib [1] . Data are from U. S. Census Bureau Core Business Statistics Series [2] [3] . Dollar amounts were adjusted to 2007 dollars by Consumer Price Index [4] | ||
| Author | Frodlimt ( talk ) | ||
|
Permission
( Reusing this file ) |
|
References
- ↑ http://matplotlib.org/
- ↑ http://factfinder2.census.gov/faces/tableservices/jsf/pages/productview.xhtml?pid=ECN_2007_US_00CCOMP1&prodType=table
- ↑ http://factfinder2.census.gov/faces/tableservices/jsf/pages/productview.xhtml?pid=ECN_2002_US_00CCOMP1&prodType=table
- ↑ ftp://ftp.bls.gov/pub/special.requests/cpi/cpiai.txt

|
This media file is uncategorized.
Please help improve this media file by adding it to one or more categories, so it may be associated with related media files (
how?
), and so that it can be more easily found.
Please notify the uploader with
{{subst:Please link images|File:Paid employees by us sector 1997-2007.svg}} ~~~~
|