Oil_Balance_Thailand.svg

Size of this PNG preview of this SVG file:
800 × 431 pixels
.
Other resolutions:
320 × 172 pixels
|
640 × 345 pixels
|
1,024 × 551 pixels
|
1,280 × 689 pixels
|
2,560 × 1,378 pixels
|
1,170 × 630 pixels
.
Summary
| Description |
English:
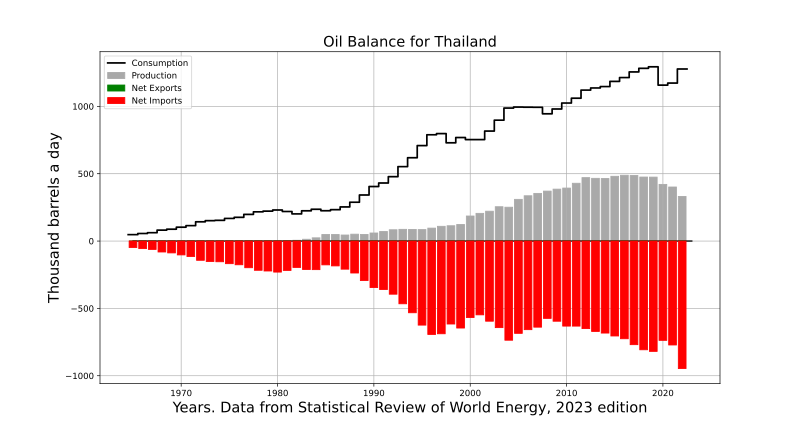
Oil balance for this country. This is meant to supersede old "ELM" graphs uploaded in 2008 by Jonathan Callahan , that are out-of-date, non-vectorial and of dubious license.
The data are from BP statistical report. note that imports or exports are approximated using the difference between production and consumption. This is a good approximation, but not 100% accurate because some countries can import and export petroleum in the same time, and it ignores refinery gains and stock changes. The graphs are generated automagically from BP's excel file using a PYTHON script. It can be found here for future updated. |
| Date | |
| Source | Own work |
| Author | Raminagrobis |
Licensing
I, the copyright holder of this work, hereby publish it under the following license:
This file is licensed under the
Creative Commons
Attribution-Share Alike 4.0 International
license.
-
You are free:
- to share – to copy, distribute and transmit the work
- to remix – to adapt the work
-
Under the following conditions:
- attribution – You must give appropriate credit, provide a link to the license, and indicate if changes were made. You may do so in any reasonable manner, but not in any way that suggests the licensor endorses you or your use.
- share alike – If you remix, transform, or build upon the material, you must distribute your contributions under the same or compatible license as the original.