New_Madrid_and_Wabash_seizmic_zones-USGS_mod.png
Size of this preview:
547 × 599 pixels
.
Other resolutions:
219 × 240 pixels
|
438 × 480 pixels
|
748 × 819 pixels
.
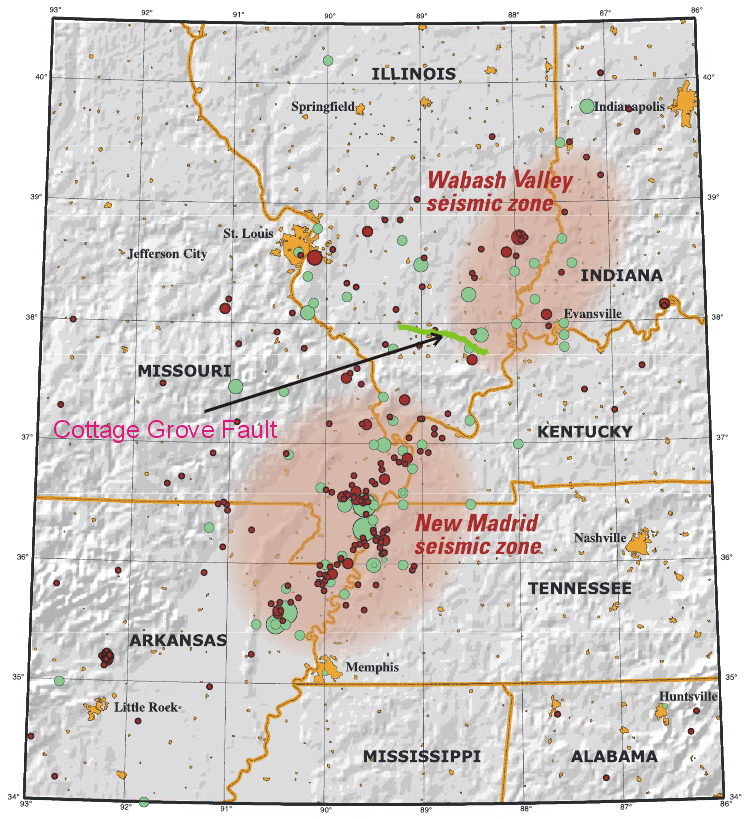
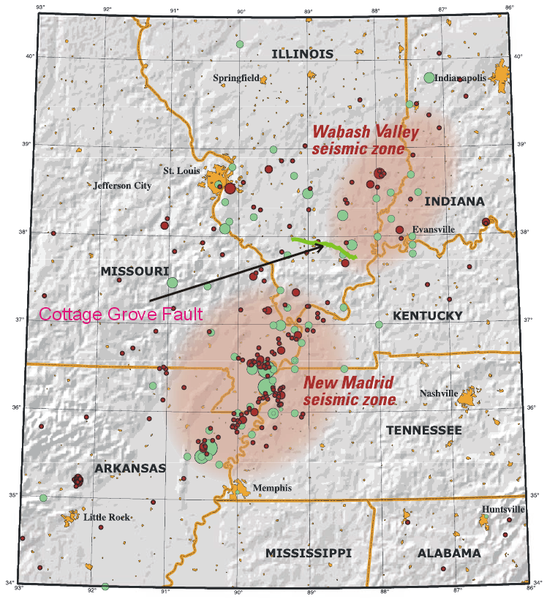
| Description | This map of the New Madrid and Wabash Valley seismic zones shows earthquakes as circles. Red circles indicate earthquakes that occurred from 1974 to 2002 with magnitudes larger than 2.5 located using modern instruments (University of Memphis). Green circles denote earthquakes that occurred prior to 1974 (USGS Professional Paper 1527). Larger earthquakes are represented by larger circles. The Cottage Grove Fault is indicated by the green line. |
| Date | (UTC) |
| Source | |
| Author |
|
|
|
This is a
retouched picture
, which means that it has been digitally altered from its original version. Modifications:
Added Cottage Fault
. The original can be viewed here:
New Madrid and Wabash seizmic zones-USGS.png
:
|
|
|
This image is in the
public domain
in the United States because it only contains materials that originally came from the
United States Geological Survey
, an agency of the
United States Department of the Interior
. For more information, see
the official USGS copyright policy
.
|
|
Original upload log
This image is a derivative work of the following images:
-
File:New_Madrid_and_Wabash_seizmic_zones-USGS.png
licensed with PD-USGov-USGS
- 2008-04-25T02:30:32Z Kbh3rd 748x819 (478218 Bytes) {{Information |Description=This map of the New Madrid and Wabash Valley seismic zones shows earthquakes as circles. Red circles indicate earthquakes that occurred from 1974 to
Uploaded with derivativeFX