Mplwp_dispersion_curves.svg

Size of this PNG preview of this SVG file:
600 × 400 pixels
.
Other resolutions:
320 × 213 pixels
|
640 × 427 pixels
|
1,024 × 683 pixels
|
1,280 × 853 pixels
|
2,560 × 1,707 pixels
.
Summary
| Description |
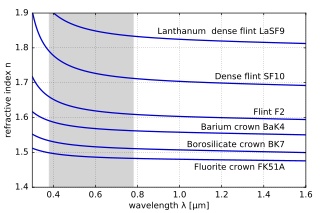
English:
Plot of
refractive index
vs.
wavelength
of various glasses. For
dispersion
. The wavelengths in the gray-shaded portion correspond to the
visible spectrum
.
Русский:
Зависимость показателя преломления от длины волны в диапазоне 0,3...1,6 мкм некоторых оптических стёкол
|
||
| Date | |||
| Source | Own work | ||
| Author | Geek3 | ||
| Other versions |
|
||
| SVG development |
This plot was created with
mplwp
, the
Matplotlib
extension for Wikipedia plots.
|
||
| Source code |
mplwp source code
|


Licensing
I, the copyright holder of this work, hereby publish it under the following license:
This file is licensed under the
Creative Commons
Attribution-Share Alike 4.0 International
license.
-
You are free:
- to share – to copy, distribute and transmit the work
- to remix – to adapt the work
-
Under the following conditions:
- attribution – You must give appropriate credit, provide a link to the license, and indicate if changes were made. You may do so in any reasonable manner, but not in any way that suggests the licensor endorses you or your use.
- share alike – If you remix, transform, or build upon the material, you must distribute your contributions under the same or compatible license as the original.