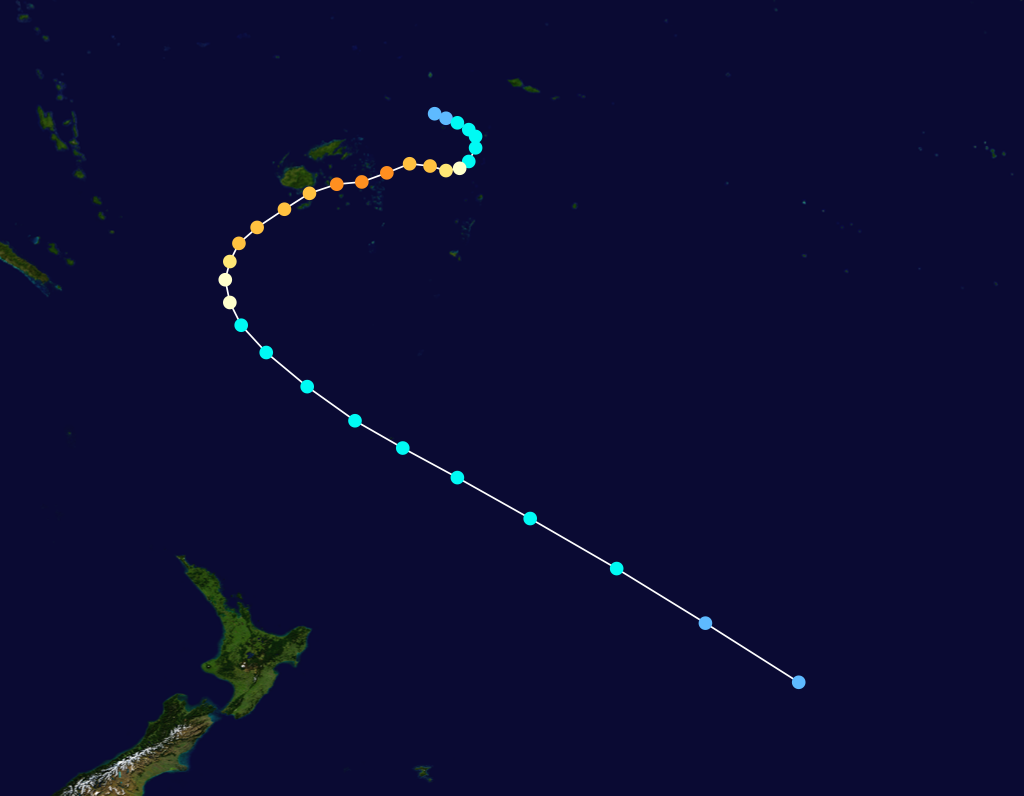
Meli_1979_track.png
Size of this preview:
771 × 599 pixels
.
Other resolutions:
309 × 240 pixels
|
618 × 480 pixels
|
988 × 768 pixels
|
1,024 × 796 pixels
.
Summary
| Description |
English:
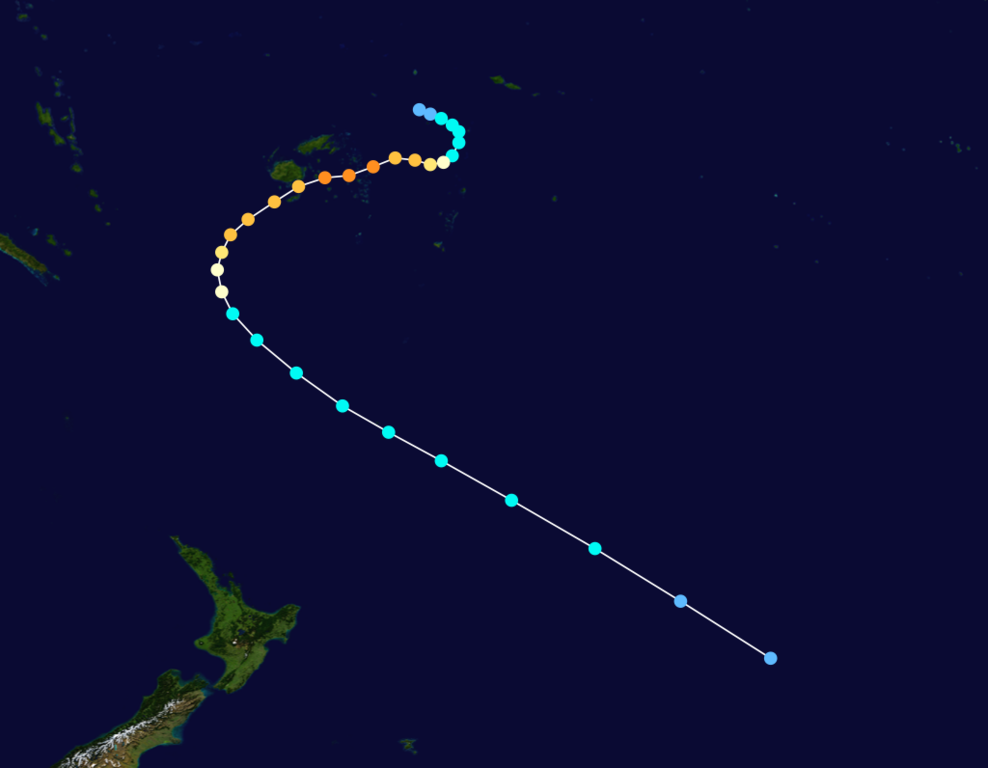
Track map of Cyclone Meli of the 1978-79 South Pacific cyclone season. The points show the location of the storm at 6-hour intervals. The colour represents the storm's
maximum sustained wind speeds
as classified in the Saffir-Simpson Hurricane Scale (see below), and the shape of the data points represent the nature of the storm, according to the legend below.
Tropical depression (≤38 mph, ≤62 km/h)
Tropical storm (39–73 mph, 63–118 km/h)
Category 1 (74–95 mph, 119–153 km/h)
Category 2 (96–110 mph, 154–177 km/h)
Category 3 (111–129 mph, 178–208 km/h)
Category 4 (130–156 mph, 209–251 km/h)
Category 5 (≥157 mph, ≥252 km/h)
Unknown
Storm type |
| Date | |
| Source | Created by Cyclonebiskit using Wikipedia:WikiProject Tropical cyclones/Tracks . The background image is from NASA . Tracking data from the National Hurricane Center [1] or the Joint Typhoon Warning Center . [2] |
| Author | Cyclonebiskit |
Licensing
|
|
I, the copyright holder of this work, release this work into the
public domain
. This applies worldwide.
In some countries this may not be legally possible; if so: I grant anyone the right to use this work for any purpose , without any conditions, unless such conditions are required by law. |