Map_of_the_phylogeographic_structure_of_Hydrobates_markhami.png

Size of this preview:
800 × 354 pixels
.
Other resolutions:
320 × 142 pixels
|
640 × 283 pixels
|
1,024 × 453 pixels
|
1,280 × 567 pixels
|
3,200 × 1,417 pixels
.
Summary
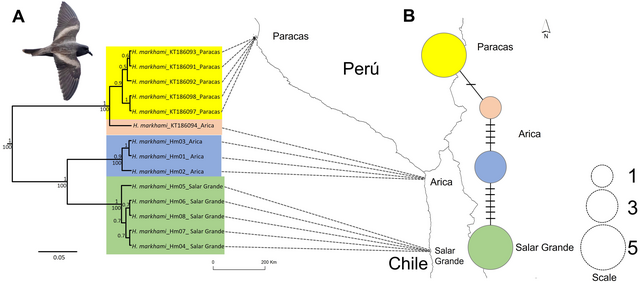
| Description | Map of the phylogeographic structure of Hydrobates markhami showing: (A) the mtDNA ND1 Bayesian Inference (BI) and Maximum Likelihood (ML) phylogeny and the distribution of the three main clades (upper node values represent BI posterior probabilities and down nodes values represent ML bootstrap values). (B) Haplotype network and each locality; the scale represents the sample size for each locality. At the bottom is the map with the breeding sites used for the genetics analysis. Out-groups on phylogeny are not shown. Photograph of H. markhami: courtesy of Fernando Díaz Segovia. |
| Date | |
| Source | https://peerj.com/articles/12669/ |
| Author | Heraldo V. Norambuena, Reinaldo Rivera, Rodrigo Barros, Rodrigo Silva, Ronny Peredo, Cristián E. Hernández |
Licensing
This file is licensed under the
Creative Commons
Attribution 4.0 International
license.
-
You are free:
- to share – to copy, distribute and transmit the work
- to remix – to adapt the work
-
Under the following conditions:
- attribution – You must give appropriate credit, provide a link to the license, and indicate if changes were made. You may do so in any reasonable manner, but not in any way that suggests the licensor endorses you or your use.