Main_belt_e_vs_a.png

Summary
| Description |
English:
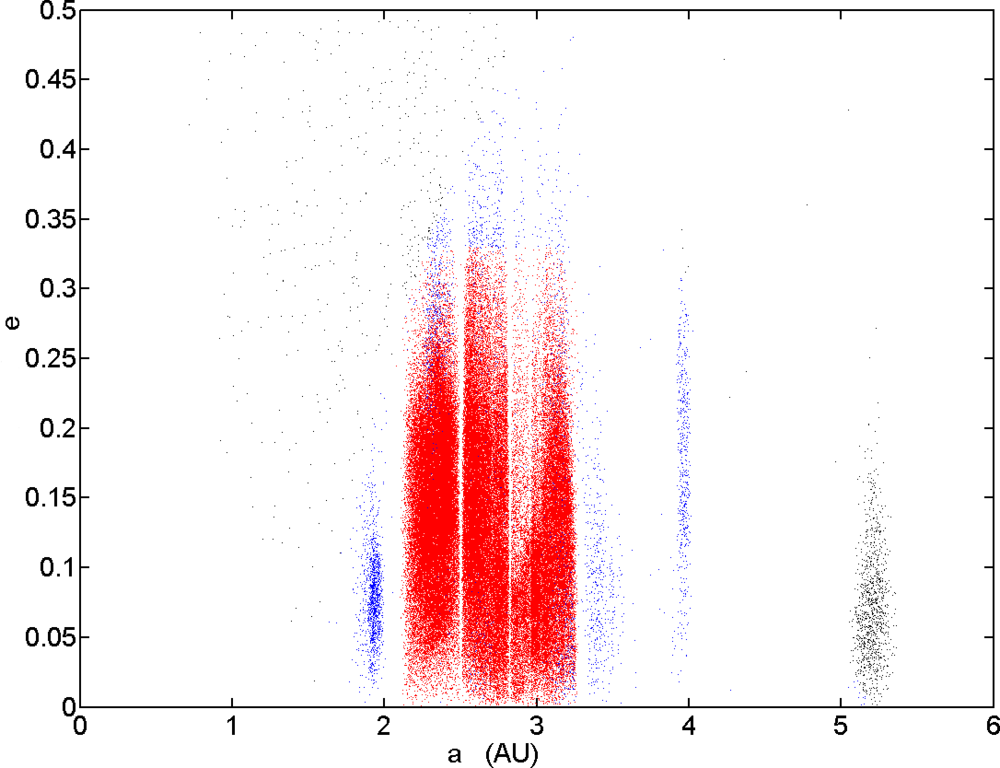
Plot of
eccentricity
e
vs
en:semi-major axis
a
for numbered
en:asteroids
inward of about 6
AU
. The
en:main belt
is shown in red and blue, and contains 98.5% of all the objects. Within this, the "core" region between the 4:1 and 2:1
en:Kirkwood gaps
, and at moderate inclinations and eccentricities is shown in red. It contains 93.4% of all the objects.
For reference, en:Mars orbits out to 1.666 AU, and en:Jupiter between 4.95 and 5.46 AU. The diagram was created by me (Piotr Deuar) using orbit data for 120437 numbered minor planets from the Minor Planet Center orbit databse , dated 8 Feb 2006. |
||
| Date | 20 February 2006 (original upload date) | ||
| Source | |||
| Author | Deuar at English Wikipedia | ||
| Other versions |
|

Licensing
|
NOTE: "subject to disclaimers" below may not actually apply, this was tagged with {{GFDL-user-en}} , and after May 2007, en:Template:GFDL-self did not require disclaimers. Please check the image description page on the English Wikipedia (or, if it has been deleted, ask an English Wikipedia administrator ). See Wikipedia:GFDL standardization for details. |
||
|
Deuar
at the
English-language Wikipedia
, the copyright holder of this work, hereby publishes it under the following license:
|
||
|
Note: This tag should not be used . For images that were released on the English Wikipedia using either GFDL or GFDL-self with disclaimers , use {{GFDL-user-en-with-disclaimers}} . For images without disclaimers please use {{GFDL-user-en-no-disclaimers}} instead. If you are the copyright holder of files that were released on Wikipedia, please consider removing the disclaimers . |

Original upload log
(All user names refer to en.wikipedia)
- 2006-12-04 17:53 Deuar 1280×929×8 (53535 bytes) modified version which distinguishes main belt/core region/rest
- 2006-02-20 18:27 Deuar 1201×901×8 (50230 bytes)