MRONJ_duration_of_oral_biphosphonate_vs_risk_graph.png

Size of this preview:
800 × 430 pixels
.
Other resolutions:
320 × 172 pixels
|
640 × 344 pixels
|
1,306 × 702 pixels
.
Summary
| Description |
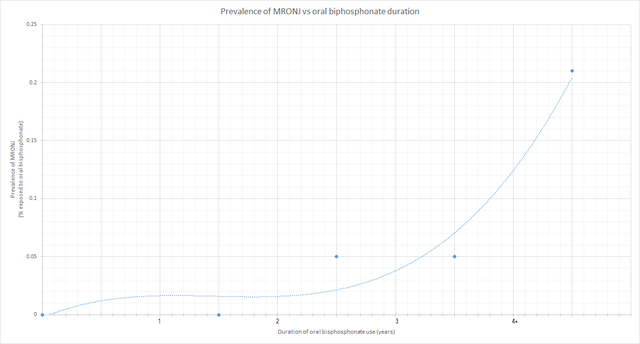
English:
graph created from data from American Association of Oral and Maxillofacial Surgeons Position Paper on Medication-Related Osteonecrosis of the Jaw—2014 Update DOI:
https://doi.org/10.1016/j.joms.2014.04.031
. Original fda source no longer online
|
| Date | |
| Source | Own work |
| Author | Ian Furst |
Licensing
I, the copyright holder of this work, hereby publish it under the following license:
This file is licensed under the
Creative Commons
Attribution-Share Alike 4.0 International
license.
-
You are free:
- to share – to copy, distribute and transmit the work
- to remix – to adapt the work
-
Under the following conditions:
- attribution – You must give appropriate credit, provide a link to the license, and indicate if changes were made. You may do so in any reasonable manner, but not in any way that suggests the licensor endorses you or your use.
- share alike – If you remix, transform, or build upon the material, you must distribute your contributions under the same or compatible license as the original.