Législatives_2017_-_Participation_au_premier_tour.svg

Size of this PNG preview of this SVG file:
512 × 466 pixels
.
Other resolutions:
264 × 240 pixels
|
527 × 480 pixels
|
844 × 768 pixels
|
1,125 × 1,024 pixels
|
2,250 × 2,048 pixels
.
Summary
| Description Législatives 2017 - Participation au premier tour.svg |
Français
:
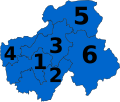
Participation au premier tour de l'élection législative française de 2017.
|
||||||
|
SVG development
InfoField
|
This
vector image
was created with
Adobe Illustrator
.
|
||||||
| Date | |||||||
| Source |
This
vector image
includes elements that have been taken or adapted from this file:
|
||||||
| Author | User:Ternoc | ||||||
|
Permission
( Reusing this file ) |
|
||||||
| Other versions |
[
edit
]
|
||||||
|
SVG development
InfoField
|
Captions
Add a one-line explanation of what this file represents


