Iso1.svg

Size of this PNG preview of this SVG file:
512 × 512 pixels
.
Other resolutions:
240 × 240 pixels
|
480 × 480 pixels
|
768 × 768 pixels
|
1,024 × 1,024 pixels
|
2,048 × 2,048 pixels
.
Summary
| Description |
English:
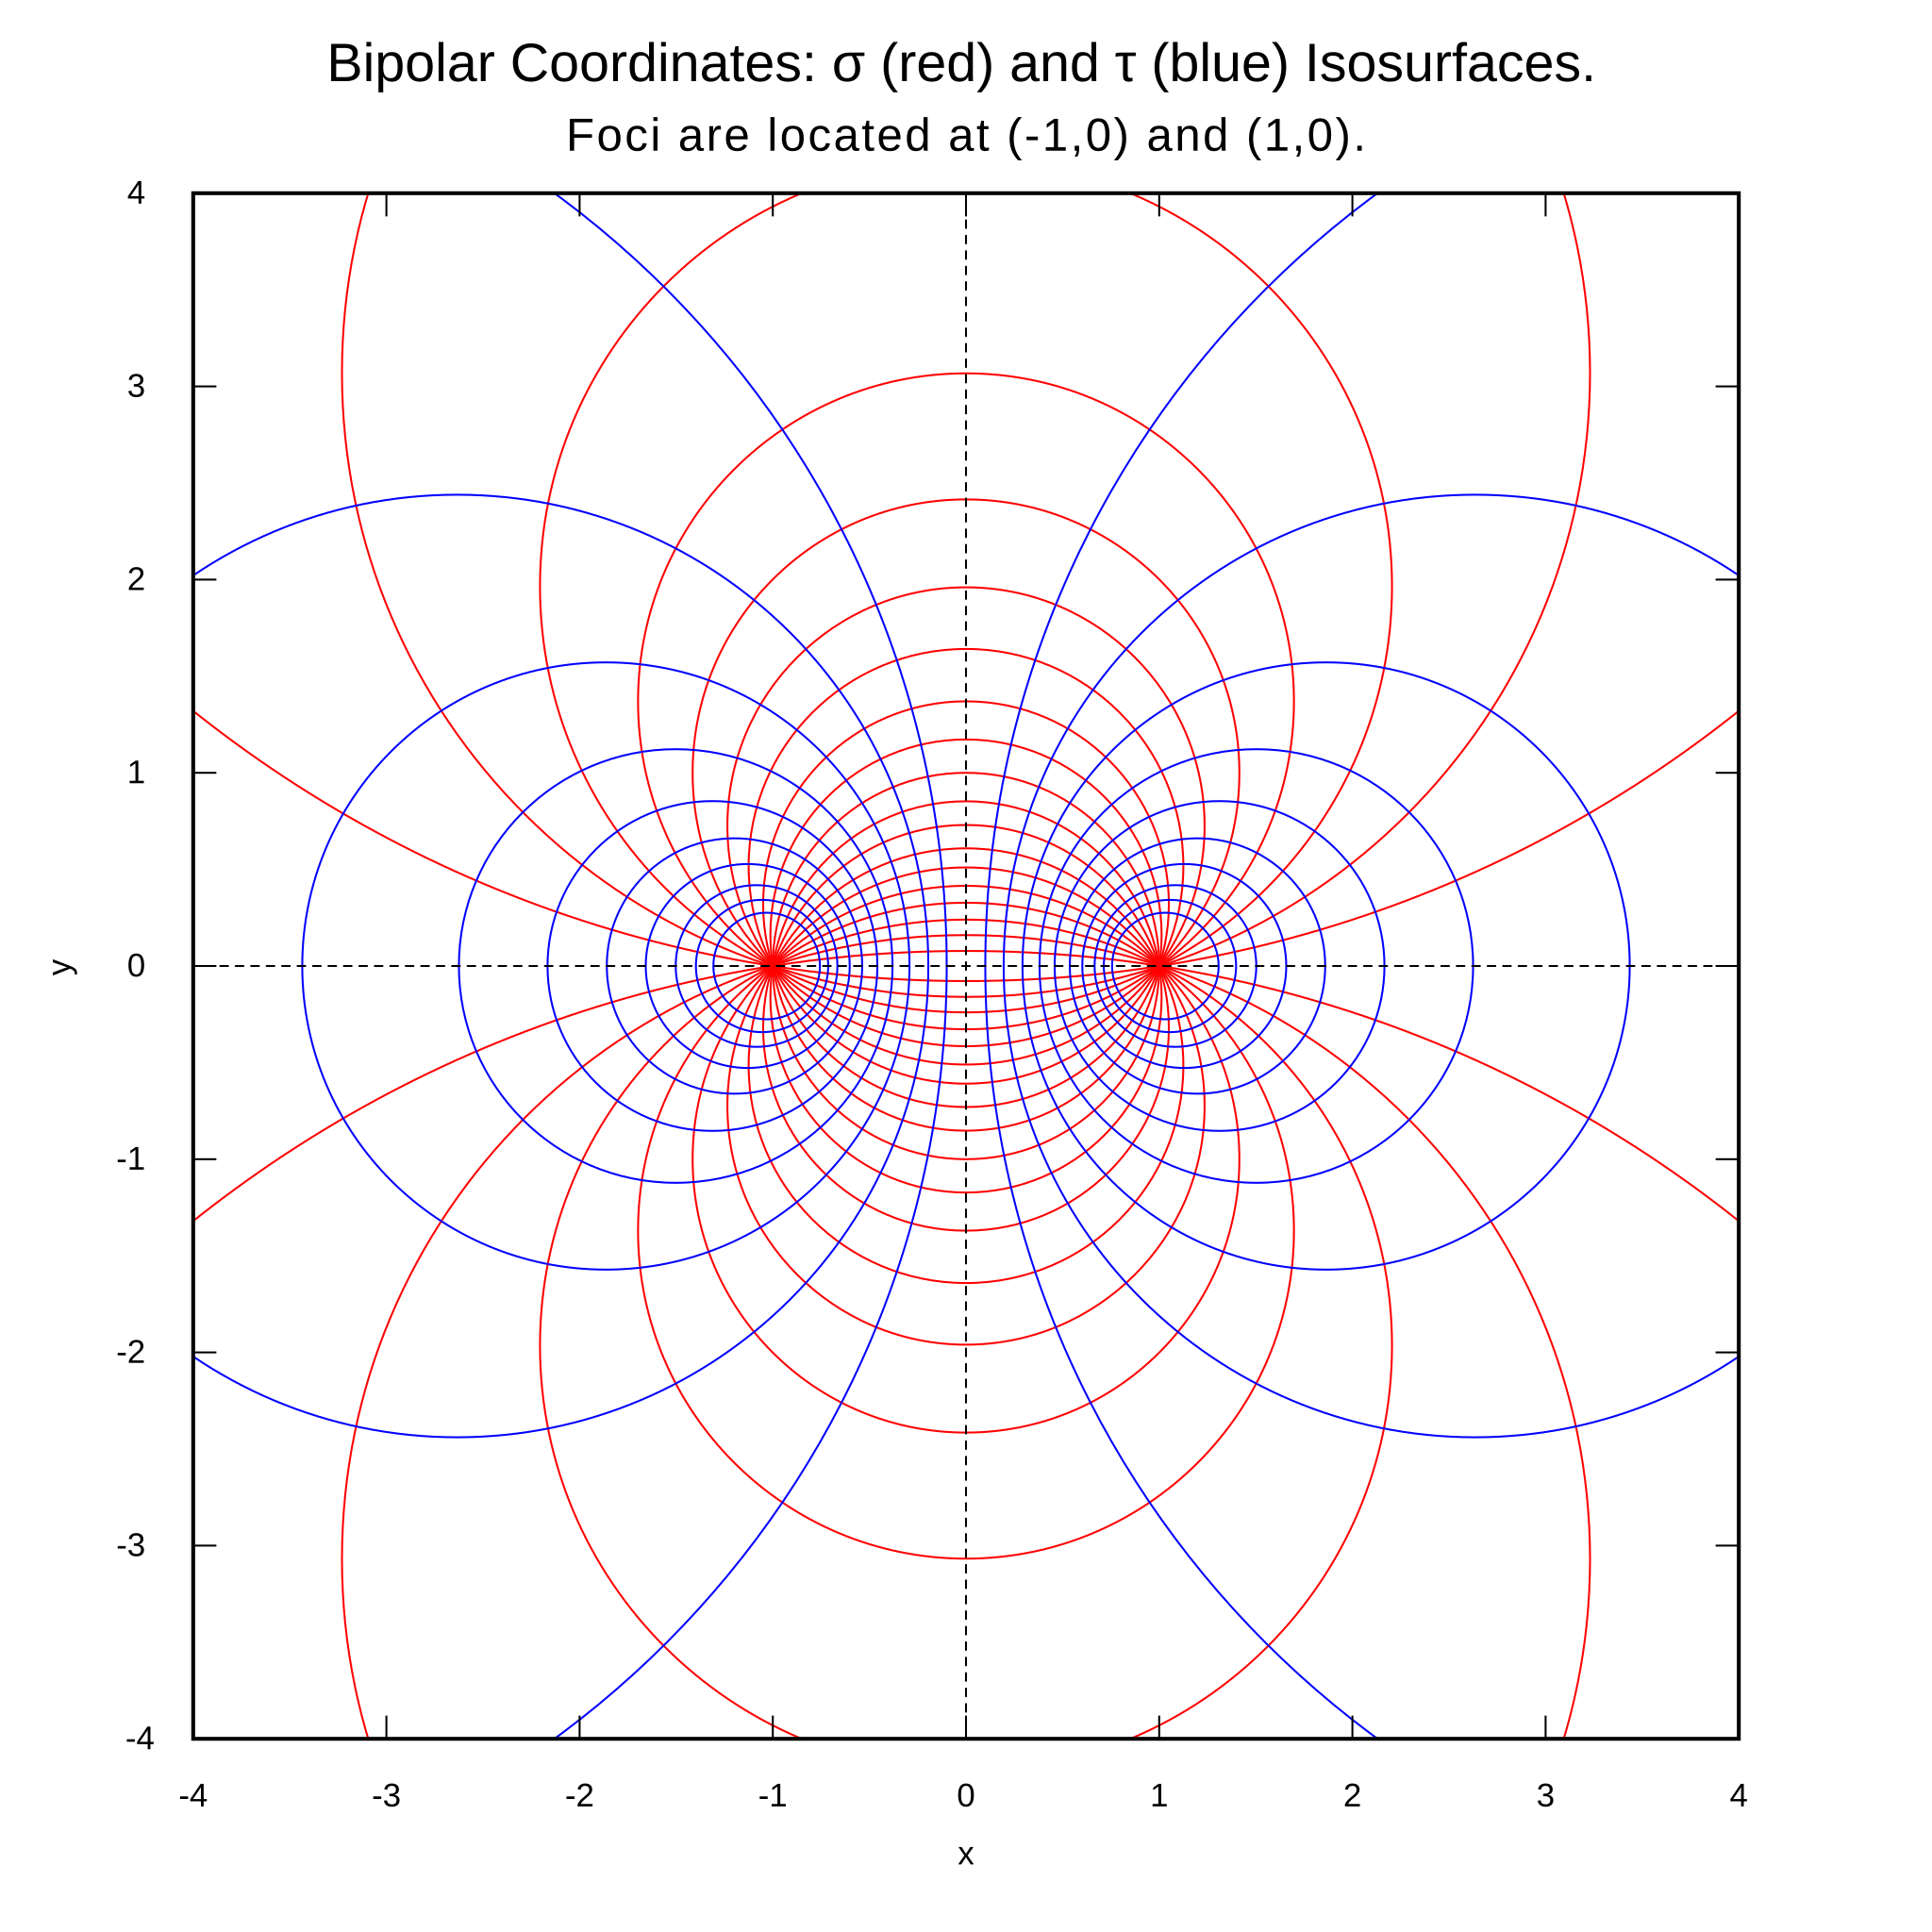
Colour image of isosurfaces of a bipolar coordinate system with foci at (-1,0) and (1,0). Red contours are plotted for values in the interval [-2,2] in steps of 0.2 while the red contours are plotted from in the range (-π/2,π/2) in steps of π/20.
The first version is a vector graphic version (SVG) of existing file Iso1.png which is a contour plot for bipolar coordinates. It uses only many many straight strokes to "draw" the curves. Produced using Inkscape, LaTeX and wxmaxima. |
| Date | |
| Source | Own work based on: Iso1.png |
| Author | Mkwadee |
| SVG development |
This diagram was created with a
text editor
.
Please
do not replace
the simplified code of this file with a version created with
Inkscape
or any other
vector graphics editor
|
Licensing
I, the copyright holder of this work, hereby publish it under the following license:
This file is licensed under the
Creative Commons
Attribution-Share Alike 4.0 International
license.
-
You are free:
- to share – to copy, distribute and transmit the work
- to remix – to adapt the work
-
Under the following conditions:
- attribution – You must give appropriate credit, provide a link to the license, and indicate if changes were made. You may do so in any reasonable manner, but not in any way that suggests the licensor endorses you or your use.
- share alike – If you remix, transform, or build upon the material, you must distribute your contributions under the same or compatible license as the original.