Illustration_diagram_for_the_Spike-triggered_average.pdf

Size of this JPG preview of this PDF file:
668 × 599 pixels
.
Other resolutions:
268 × 240 pixels
|
535 × 480 pixels
|
856 × 768 pixels
|
1,141 × 1,024 pixels
|
1,702 × 1,527 pixels
.
Summary
| Description |
English:
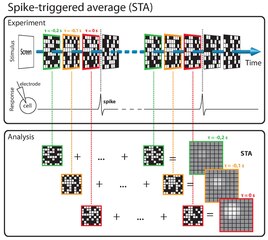
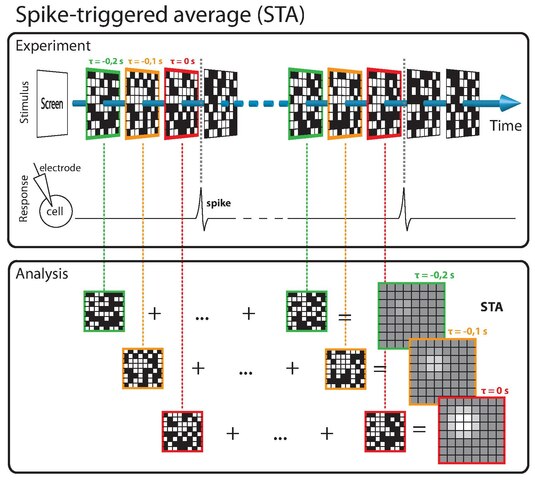
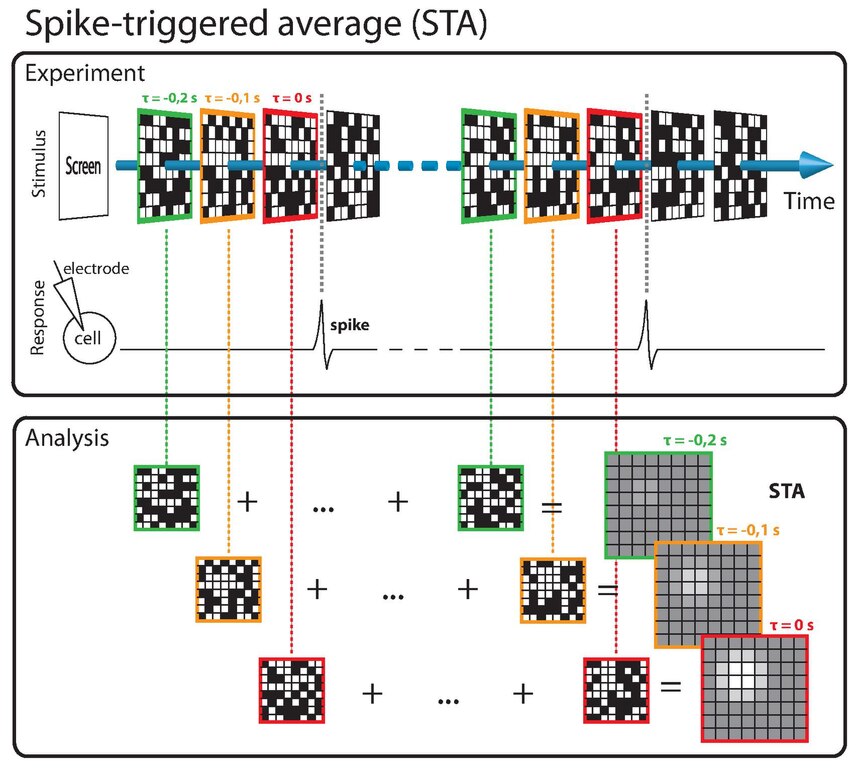
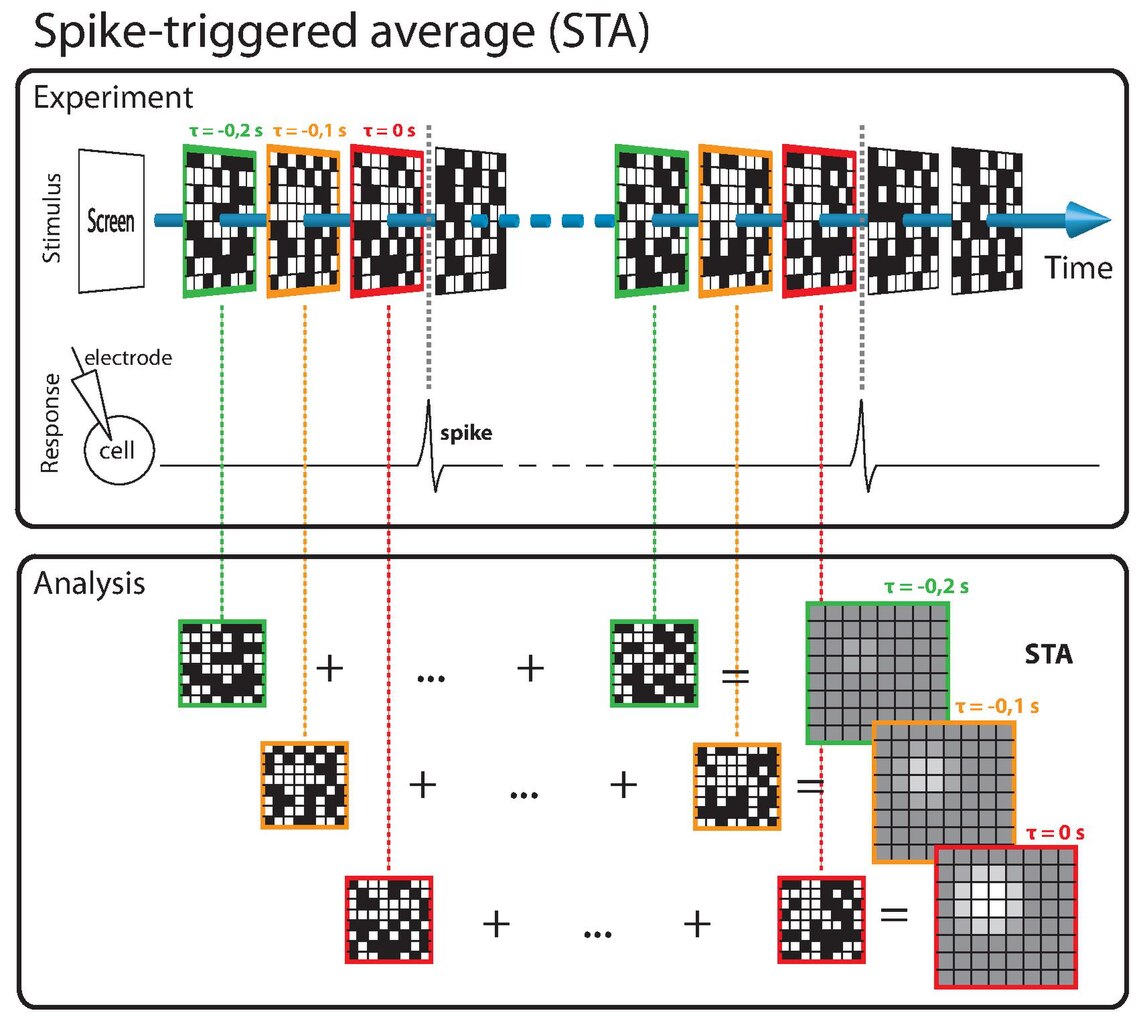
Diagram showing how the STA is calculated. A stimulus (consisting here of a checkerboard with random pixels) is presented, and spikes from the neuron are recorded. The stimuli in some time window preceding each spike (here consisting of 3 time bins) are selected (color boxes) and then averaged to obtain the STA. The STA indicates that this neuron is selective for a bright spot of light just before the spike, in the top-left corner of the checkerboard.
|
| Date | |
| Source | Own work |
| Author | StphTphsn |
Licensing
I, the copyright holder of this work, hereby publish it under the following license:
This file is licensed under the
Creative Commons
Attribution-Share Alike 4.0 International
license.
-
You are free:
- to share – to copy, distribute and transmit the work
- to remix – to adapt the work
-
Under the following conditions:
- attribution – You must give appropriate credit, provide a link to the license, and indicate if changes were made. You may do so in any reasonable manner, but not in any way that suggests the licensor endorses you or your use.
- share alike – If you remix, transform, or build upon the material, you must distribute your contributions under the same or compatible license as the original.