Hill_Plot_MWC_model.png
No higher resolution available.
Summary
| Description |
English:
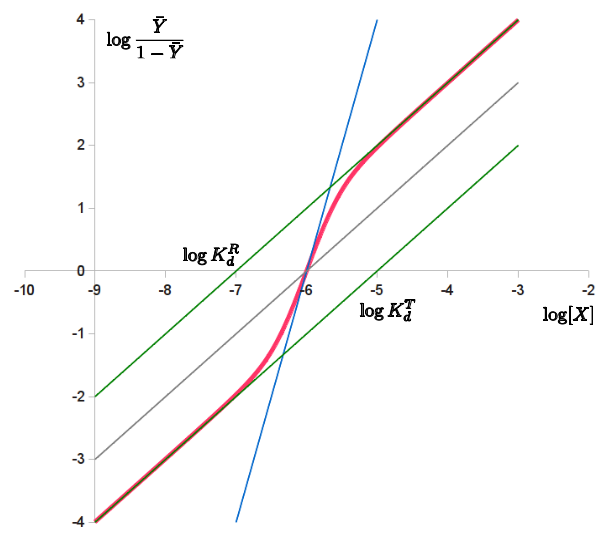
Hill plot of the Monod-Wyman-Changeux model, showing the changing slope of the binding function in red, indicating a Hill coefficient depending on saturation, and the intercepts of the green asymptots providing the dissociation constants of the R and T states. In blue is shown the corresponding Hill function and in grey the corresponding non-cooperative binding.
|
| Date | |
| Source | Own work |
| Author | Lenov |
Licensing
I, the copyright holder of this work, hereby publish it under the following license:
This file is licensed under the
Creative Commons
Attribution 3.0 Unported
license.
-
You are free:
- to share – to copy, distribute and transmit the work
- to remix – to adapt the work
-
Under the following conditions:
- attribution – You must give appropriate credit, provide a link to the license, and indicate if changes were made. You may do so in any reasonable manner, but not in any way that suggests the licensor endorses you or your use.