Gaussian_beam_w40mm_lambda30mm.png

Size of this preview:
800 × 434 pixels
.
Other resolutions:
320 × 173 pixels
|
640 × 347 pixels
|
1,024 × 555 pixels
|
1,450 × 786 pixels
.
Summary
| Description |
English:
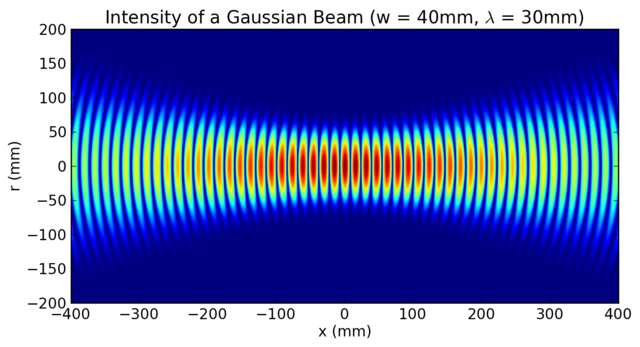
This is a plot of the instantaneous intensity of a Gaussian beam as a function of r and x.
Author: Eric Toombs Source: computer rendering via matplotlib
This plot was created with
Matplotlib
.
|
| Date | 25 July 2011 (original upload date) |
| Source | Transferred from en.wikipedia by Ronhjones |
| Author | Etoombs at en.wikipedia |

Licensing
Etoombs
at
en.wikipedia
, the copyright holder of this work, hereby publishes it under the following license:
This file is licensed under the
Creative Commons
Attribution 3.0 Unported
license.
Attribution:
Etoombs
at
en.wikipedia
-
You are free:
- to share – to copy, distribute and transmit the work
- to remix – to adapt the work
-
Under the following conditions:
- attribution – You must give appropriate credit, provide a link to the license, and indicate if changes were made. You may do so in any reasonable manner, but not in any way that suggests the licensor endorses you or your use.
Original upload log
The original description page was
here
. All following user names refer to en.wikipedia.
Upload date | User | Bytes | Dimensions | Comment
- 2011-07-25 07:20 (UTC) | Etoombs | 469446 (bytes) | 1450×786 | Sign error. Just compare the two images yourself to see what I changed.
- 2011-07-25 06:52 (UTC) | Etoombs | 437214 (bytes) | 1420×662 | This is a plot of the instantaneous intensity of a Gaussian beam as a function of r and z. Author: Eric Toombs Source: computer rendering via matplotlib