Floyd_flood_map.jpg
No higher resolution available.
Summary
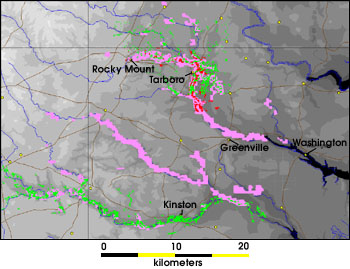
This flood map shows a comparison of the flood data collected by AVHRR (pink pixels), Radarsat (red pixels), and Landsat 7 (green pixels). These colors show areas that were flooded in the wake of Hurricane Floyd. Due to interference from clouds and forest canopies, geographers often get the best insight into a flood when they use data from multiple satellite sensors. (Image courtesy Dartmouth Flood Observatory, E. Anderson and R.H. Brakenridge)
| Color | Date | Source |
|---|---|---|
| September 17 | AVHRR | |
| September 23 | Radarsat | |
| September 30 | Landsat 7 |
Source
http://earthobservatory.nasa.gov/Study/FloydSediment/sediment_2.html - a larger image is available; the smaller image is preferred here because the text is larger
Licensing
|
|
This file is in the public domain in the United States because it was solely created by NASA . NASA copyright policy states that "NASA material is not protected by copyright unless noted ". (See Template:PD-USGov , NASA copyright policy page or JPL Image Use Policy .) |
|

|
Warnings:
|