Energy_flows_in_car.svg

Size of this PNG preview of this SVG file:
555 × 599 pixels
.
Other resolutions:
222 × 240 pixels
|
445 × 480 pixels
|
711 × 768 pixels
|
949 × 1,024 pixels
|
1,897 × 2,048 pixels
|
630 × 680 pixels
.
Summary
| Description |
English:
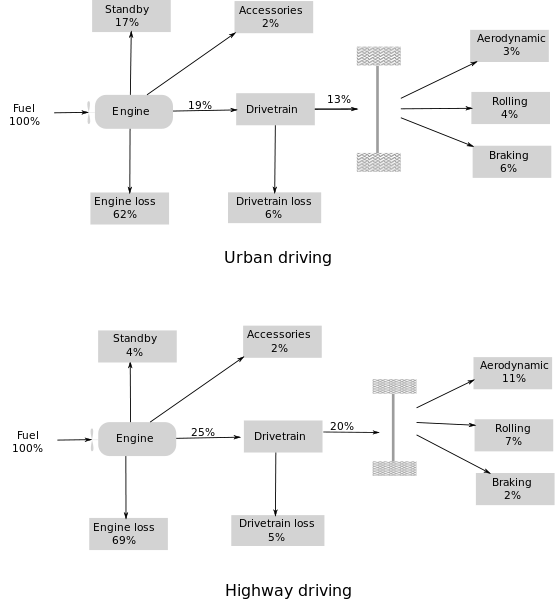
US DOE car efficiency by loss.
FIGURE 3-1 Example energy flows for a late-model midsize passenger car: (a) urban driving; (b) highway driving. [SOURCE: U.S. Department of Energy (www.fueleconomy.gov/feg/atv.shtml).] |
| Date | |
| Source | http://www.trb.org/publications/sr/sr286.pdf ; TRANSPORTATION RESEARCH BOARD SPECIAL REPORT 286 TIRES AND PASSENGER VEHICLE FUEL ECONOMY Fig 3-1, p.63 of pdf, p.40 of report |
| Author | US DOE |
| Other versions |
Derivative works of this file: |
Licensing
|
|
This image is a work of a
United States Department of Energy
(or predecessor organization) employee, taken or made as part of that person's official duties. As a
work
of the
U.S. federal government
, the image is in the
public domain
.
Please note that national laboratories operate under varying licences and some are not free . Check the site policies of any national lab before crediting it with this tag.
|

|
Original upload log
The original description page was
here
. All following user names refer to en.wikipedia.
Upload date | User | Bytes | Dimensions | Comment
- 2009-03-28 17:00 (UTC) | Aveekbh | 47337 (bytes) | 630×680 | {{Information |Description= US DOE car efficiency by loss. FIGURE 3-1 Example energy flows for a late-model midsize passenger car: (a) urban driving; (b) highway driving. [SOURCE: U.S. Department of Energy (www.fueleconomy.gov/feg/atv.shtml).] TRANSPOR