Discontinuity_of_the_sign_function_at_0.svg

Size of this PNG preview of this SVG file:
499 × 366 pixels
.
Other resolutions:
320 × 235 pixels
|
640 × 469 pixels
|
1,024 × 751 pixels
|
1,280 × 939 pixels
|
2,560 × 1,878 pixels
.
Summary
| Description |
English:
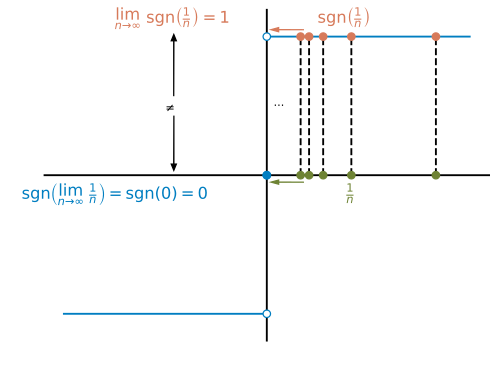
Diagram showing that the sign function is not continuous at the point 0.
|
| Date | |
| Source | Own work |
| Author | Stephan Kulla ( User:Stephan Kulla ) |
| SVG development |
This plot was created with
Matplotlib
.
|
| Source code |
Python codeimport matplotlib.pyplot as plt
import numpy as np
xs1 = np.linspace(0.0001, 1.2, 100)
xs2 = np.linspace(-1.2, -0.0001, 100)
blue="#007ec1"
orange="#d77a5a"
green="#6e8334"
fs = 13
plt.axis("off")
plt.axhline(color="black")
plt.axvline(color="black")
plt.ylim((-1.2, 1.2))
plt.plot(xs1, np.sign(xs1), color=blue)
plt.plot(xs2, np.sign(xs2), color=blue)
plt.plot([0], [0], "o", color=blue)
plt.plot([0], [1], "o", markerfacecolor="white", color=blue)
plt.plot([0], [-1], "o", markerfacecolor="white", color=blue)
plt.plot([0], [0], "o", color=blue)
plt.text(-1.45, -0.17, "$\operatorname{sgn}\left(\lim_{n\\to\infty}\ \\frac{1}{n}\\right) = \operatorname{sgn}(0)=0$", color=blue, fontsize=fs)
plt.text(-0.9, 1.1, "$\lim_{n\\to\infty}\ \operatorname{sgn}\left(\\frac{1}{n}\\right) =1$", color=orange, fontsize=fs)
for n in range(1,6):
plt.plot([1./n, 1./n], [0, 1], "--", color="black")
plt.plot([1./n], [1], "o", color=orange)
plt.plot([1./n], [0], "o", color=green)
plt.text(0.3, 1.1, '$\operatorname{sgn}\left(\\frac{1}{n}\\right)$', color=orange, fontsize=fs)
plt.text(0.47, -0.17, "$\\frac{1}{n}$", color=green, fontsize=fs)
plt.text(0.04, 0.5, "...", fontsize=fs-4)
plt.arrow(0.22,1.05,-0.15,0, color=orange, linewidth=1, head_width=0.03)
plt.arrow(0.22,-0.05,-0.15,0, color=green, linewidth=1, head_width=0.03)
plt.arrow(-0.55,0.57,0,0.4, color="black", head_width=0.03)
plt.arrow(-0.55,0.43,0,-0.35, color="black", head_width=0.03)
plt.text(-0.6,0.46, u'\u2260', fontsize=fs-4, color="black")
plt.savefig("Discontinuity of the sign function at 0.svg", transparent=True, bbox_inches="tight", pad_inches=0.05)
|
Licensing
I, the copyright holder of this work, hereby publish it under the following license:
This file is licensed under the
Creative Commons
Attribution-Share Alike 4.0 International
license.
-
You are free:
- to share – to copy, distribute and transmit the work
- to remix – to adapt the work
-
Under the following conditions:
- attribution – You must give appropriate credit, provide a link to the license, and indicate if changes were made. You may do so in any reasonable manner, but not in any way that suggests the licensor endorses you or your use.
- share alike – If you remix, transform, or build upon the material, you must distribute your contributions under the same or compatible license as the original.