Ch4_gr_gl.png
Size of this preview:
800 × 480 pixels
.
Other resolution:
320 × 192 pixels
.
Summary
| Description |
English:
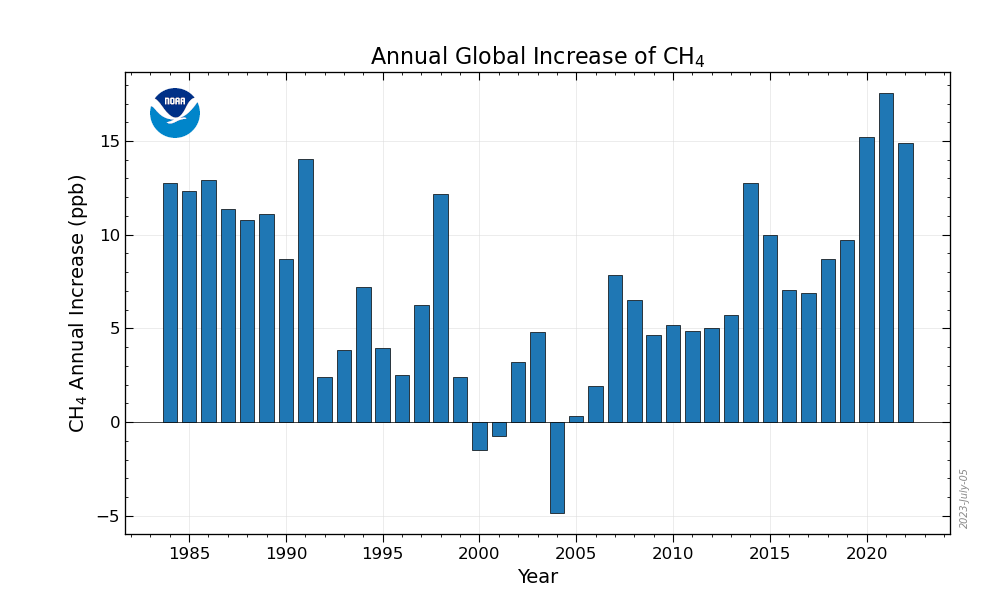
The annual increase in atmospheric CH4 in a given year is the increase in its abundance (mole fraction) from January 1 in that year to January 1 of the next year, after the seasonal cycle has been removed (as shown by the black lines in the figure above). It represents the sum of all CH4 added to, and removed from, the atmosphere during the year by human activities and natural processes.
|
| Date | |
| Source |
https://gml.noaa.gov/ccgg/trends_ch4/ Lan, X., K.W. Thoning, and E.J. Dlugokencky: Trends in globally-averaged CH4, N2O, and SF6 determined from NOAA Global Monitoring Laboratory measurements. Version 2022-11, https://doi.org/10.15138/P8XG-AA10 |
| Author | NOAA Global Monitoring Laboratory |
Licensing
|
|
This image is in the
public domain
because it contains materials that originally came from the U.S.
National Oceanic and Atmospheric Administration
, taken or made as part of an employee's official duties.
|
|