Canada_polling_since_2011_election.png

Size of this preview:
800 × 395 pixels
.
Other resolutions:
320 × 158 pixels
|
640 × 316 pixels
|
1,364 × 674 pixels
.
Summary
| Description |
English:
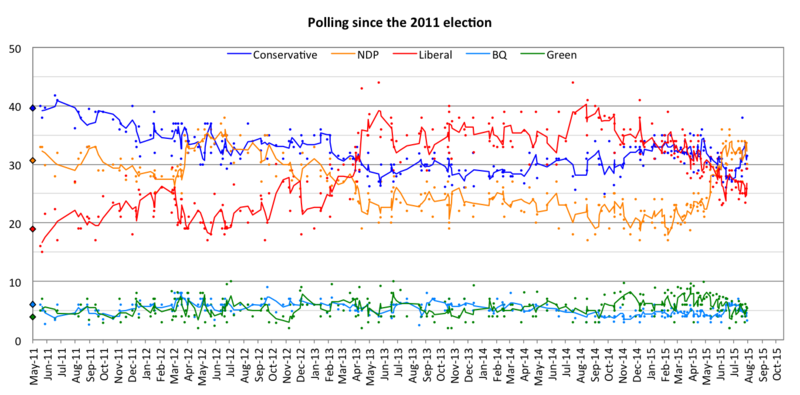
Evolution of Canadians' voting intentions since the federal election of May 2, 2011. Points represent results of individual polls. Trend lines represent three-poll moving averages.
|
||
| Date | 30 January 2024 | ||
| Source | Own work , made with Microsoft Excel 2011 for Mac | ||
| Author | Undermedia | ||
| Other versions |
|

Licensing
I, the copyright holder of this work, hereby publish it under the following license:
This file is licensed under the
Creative Commons
Attribution-Share Alike 3.0 Unported
license.
-
You are free:
- to share – to copy, distribute and transmit the work
- to remix – to adapt the work
-
Under the following conditions:
- attribution – You must give appropriate credit, provide a link to the license, and indicate if changes were made. You may do so in any reasonable manner, but not in any way that suggests the licensor endorses you or your use.
- share alike – If you remix, transform, or build upon the material, you must distribute your contributions under the same or compatible license as the original.