Brian_Booth_graph.png
No higher resolution available.
Summary
| Description |
English:
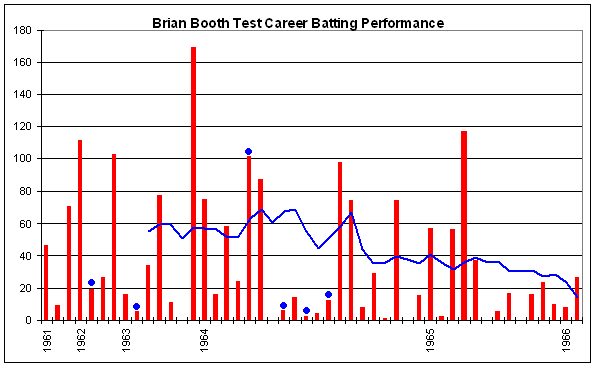
Test batting chart of
Brian Booth
. Red columns are the runs in the innings. Blue dots indicate not outs. Blue line is average in the last ten innings. Thanks to Raven4x4x for providing the template.
Source for the stats is
|
| Date | 4 December 2007 (original upload date) |
| Source |
Own work
Transferred from en.wikipedia |
| Author | YellowMonkey at en.wikipedia |
Licensing
YellowMonkey
at
en.wikipedia
, the copyright holder of this work, hereby publishes it under the following license:

|
Permission is granted to copy, distribute and/or modify this document under the terms of the GNU Free Documentation License , Version 1.2 or any later version published by the Free Software Foundation ; with no Invariant Sections, no Front-Cover Texts, and no Back-Cover Texts. A copy of the license is included in the section entitled GNU Free Documentation License . |
|
|
This file is licensed under the Creative Commons Attribution-Share Alike 3.0 Unported license. | |
| Attribution: YellowMonkey at en.wikipedia | ||
|
||
| This licensing tag was added to this file as part of the GFDL licensing update . |
Original upload log
The original description page was
here
. All following user names refer to en.wikipedia.
- 2007-12-04 01:04 YellowMonkey 597×369 (12810 bytes) == Summary == Test batting chart of [[Brian Booth]]. Red columns are the runs in the innings. Blue dots indicate not outs. Blue line is average in the last ten innings. Thanks to Raven4x4x for providing the template. == Licensing == {{GFDL-self-no-disclai