Annual_population_growth_rate_by_U.S._state.svg


|
This image is expected to always be the most recent one. Feel free to update it when needed.
|
Summary
| Description |
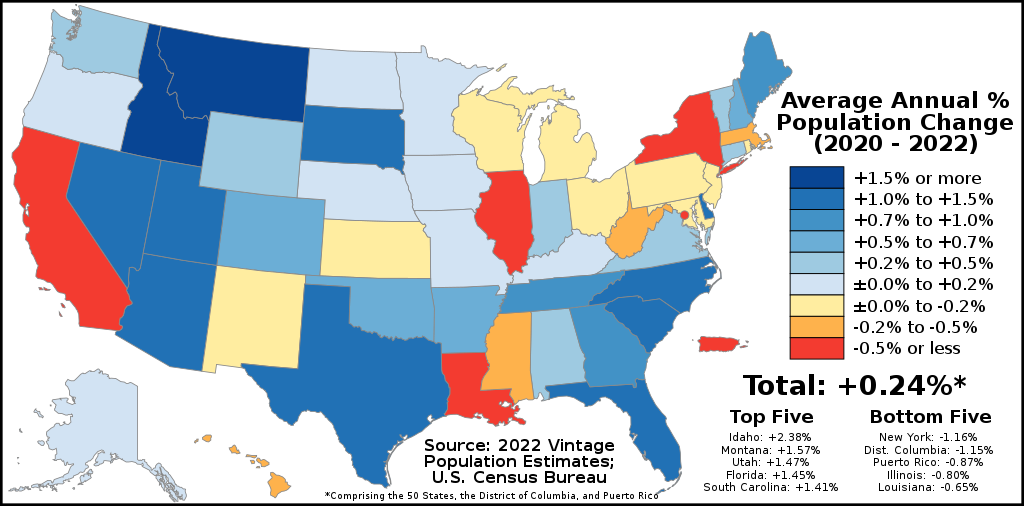
English:
The map above shows the average annual resident population growth rate of each U.S. state, the District of Columbia, and Puerto Rico according to the latest official estimates, which is currently the 2022 Vintage Population Estimates. Results can be found
here
.
The timeframe used for this map will always be between the most recent official population estimates and the most recent official U.S. Census results (or in the case that the most recent official population estimates date to a census year, then the census before that one). So currently, the timeframe for this map goes from the 2020 United States Census resident populations to the 2022 Vintage Population Estimates. This file should next be updated when the 2023 Vintage Population Estimates are released on the statewide level, currently expected to occur in December 2023 . The timeframe of this map will then be switched from "2020 - 2022" to "2020 - 2023". Average Annual Growth Rates are used instead of the total percentage growth rate since the last census for consistency and to prevent a new legend from being used every single year. Legend
+1.5% or more
+1.0% to +1.5%
+0.7% to +1.0%
+0.5% to +0.7%
+0.2% to +0.5%
±0.0% to +0.2%
±0.0% to -0.2%
-0.2% to -0.5%
-0.5% or less
|
| Date | |
| Source | Own work |
| Author | Abbasi786786 |
Licensing
-
You are free:
- to share – to copy, distribute and transmit the work
- to remix – to adapt the work
-
Under the following conditions:
- attribution – You must give appropriate credit, provide a link to the license, and indicate if changes were made. You may do so in any reasonable manner, but not in any way that suggests the licensor endorses you or your use.
- share alike – If you remix, transform, or build upon the material, you must distribute your contributions under the same or compatible license as the original.