Agonists_v2.png
Size of this preview:
800 × 390 pixels
.
Other resolutions:
320 × 156 pixels
|
640 × 312 pixels
|
1,024 × 500 pixels
|
1,280 × 624 pixels
|
2,349 × 1,146 pixels
.
Summary
| Description |
English:
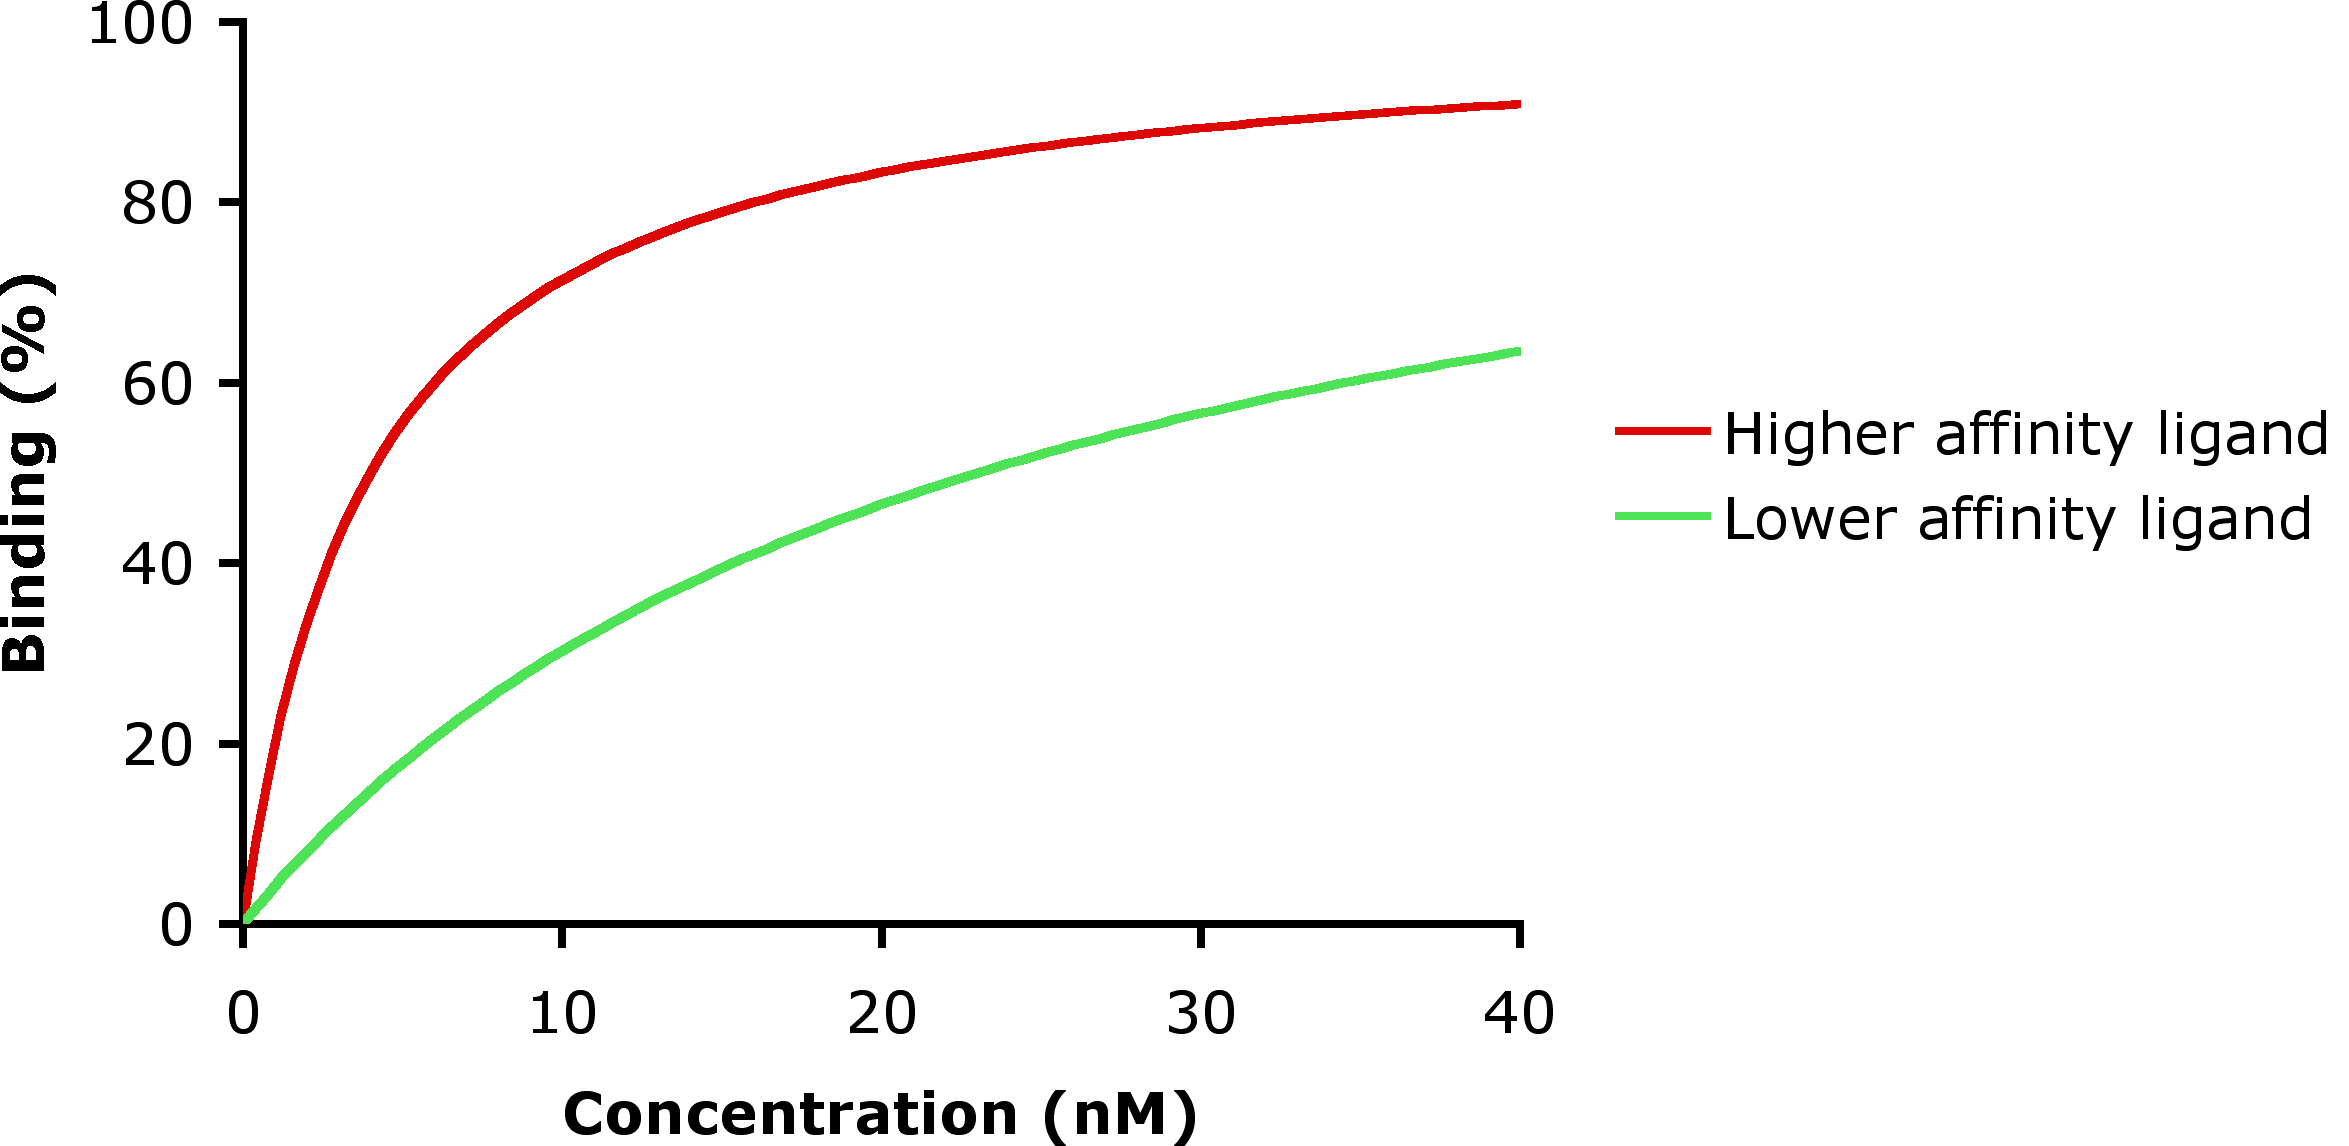
A plot of the proportion of receptors bound with two different agonists at varying agonist concentrations. In this plot, a higher affinity agonist (red) and a lower affinity agonist are compared. Classical binding to the receptors, with Michaelis–Menten kinetics, has been assumed. This plot is in linear-linear co-ordinates. On log-linear coordinates the green curve would have the same shape as the red one, but would be 'right-shifted'.
|
| Date | |
| Source | I generated this graph using Excel. |
| Author | Keith Larence Brain |

Licensing
I, the copyright holder of this work, hereby publish it under the following license:
|
|
This file is made available under the Creative Commons CC0 1.0 Universal Public Domain Dedication . |
|
The person who associated a work with this deed has dedicated the work to the
public domain
by waiving all of their rights to the work worldwide under copyright law, including all related and neighboring rights, to the extent allowed by law. You can copy, modify, distribute and perform the work, even for commercial purposes, all without asking permission.
|