A0V-blackbody_SPD_comparison.png
Size of this preview:
800 × 492 pixels
.
Other resolutions:
320 × 197 pixels
|
640 × 394 pixels
|
1,024 × 630 pixels
|
1,280 × 788 pixels
|
2,500 × 1,539 pixels
.
Summary
| Description |
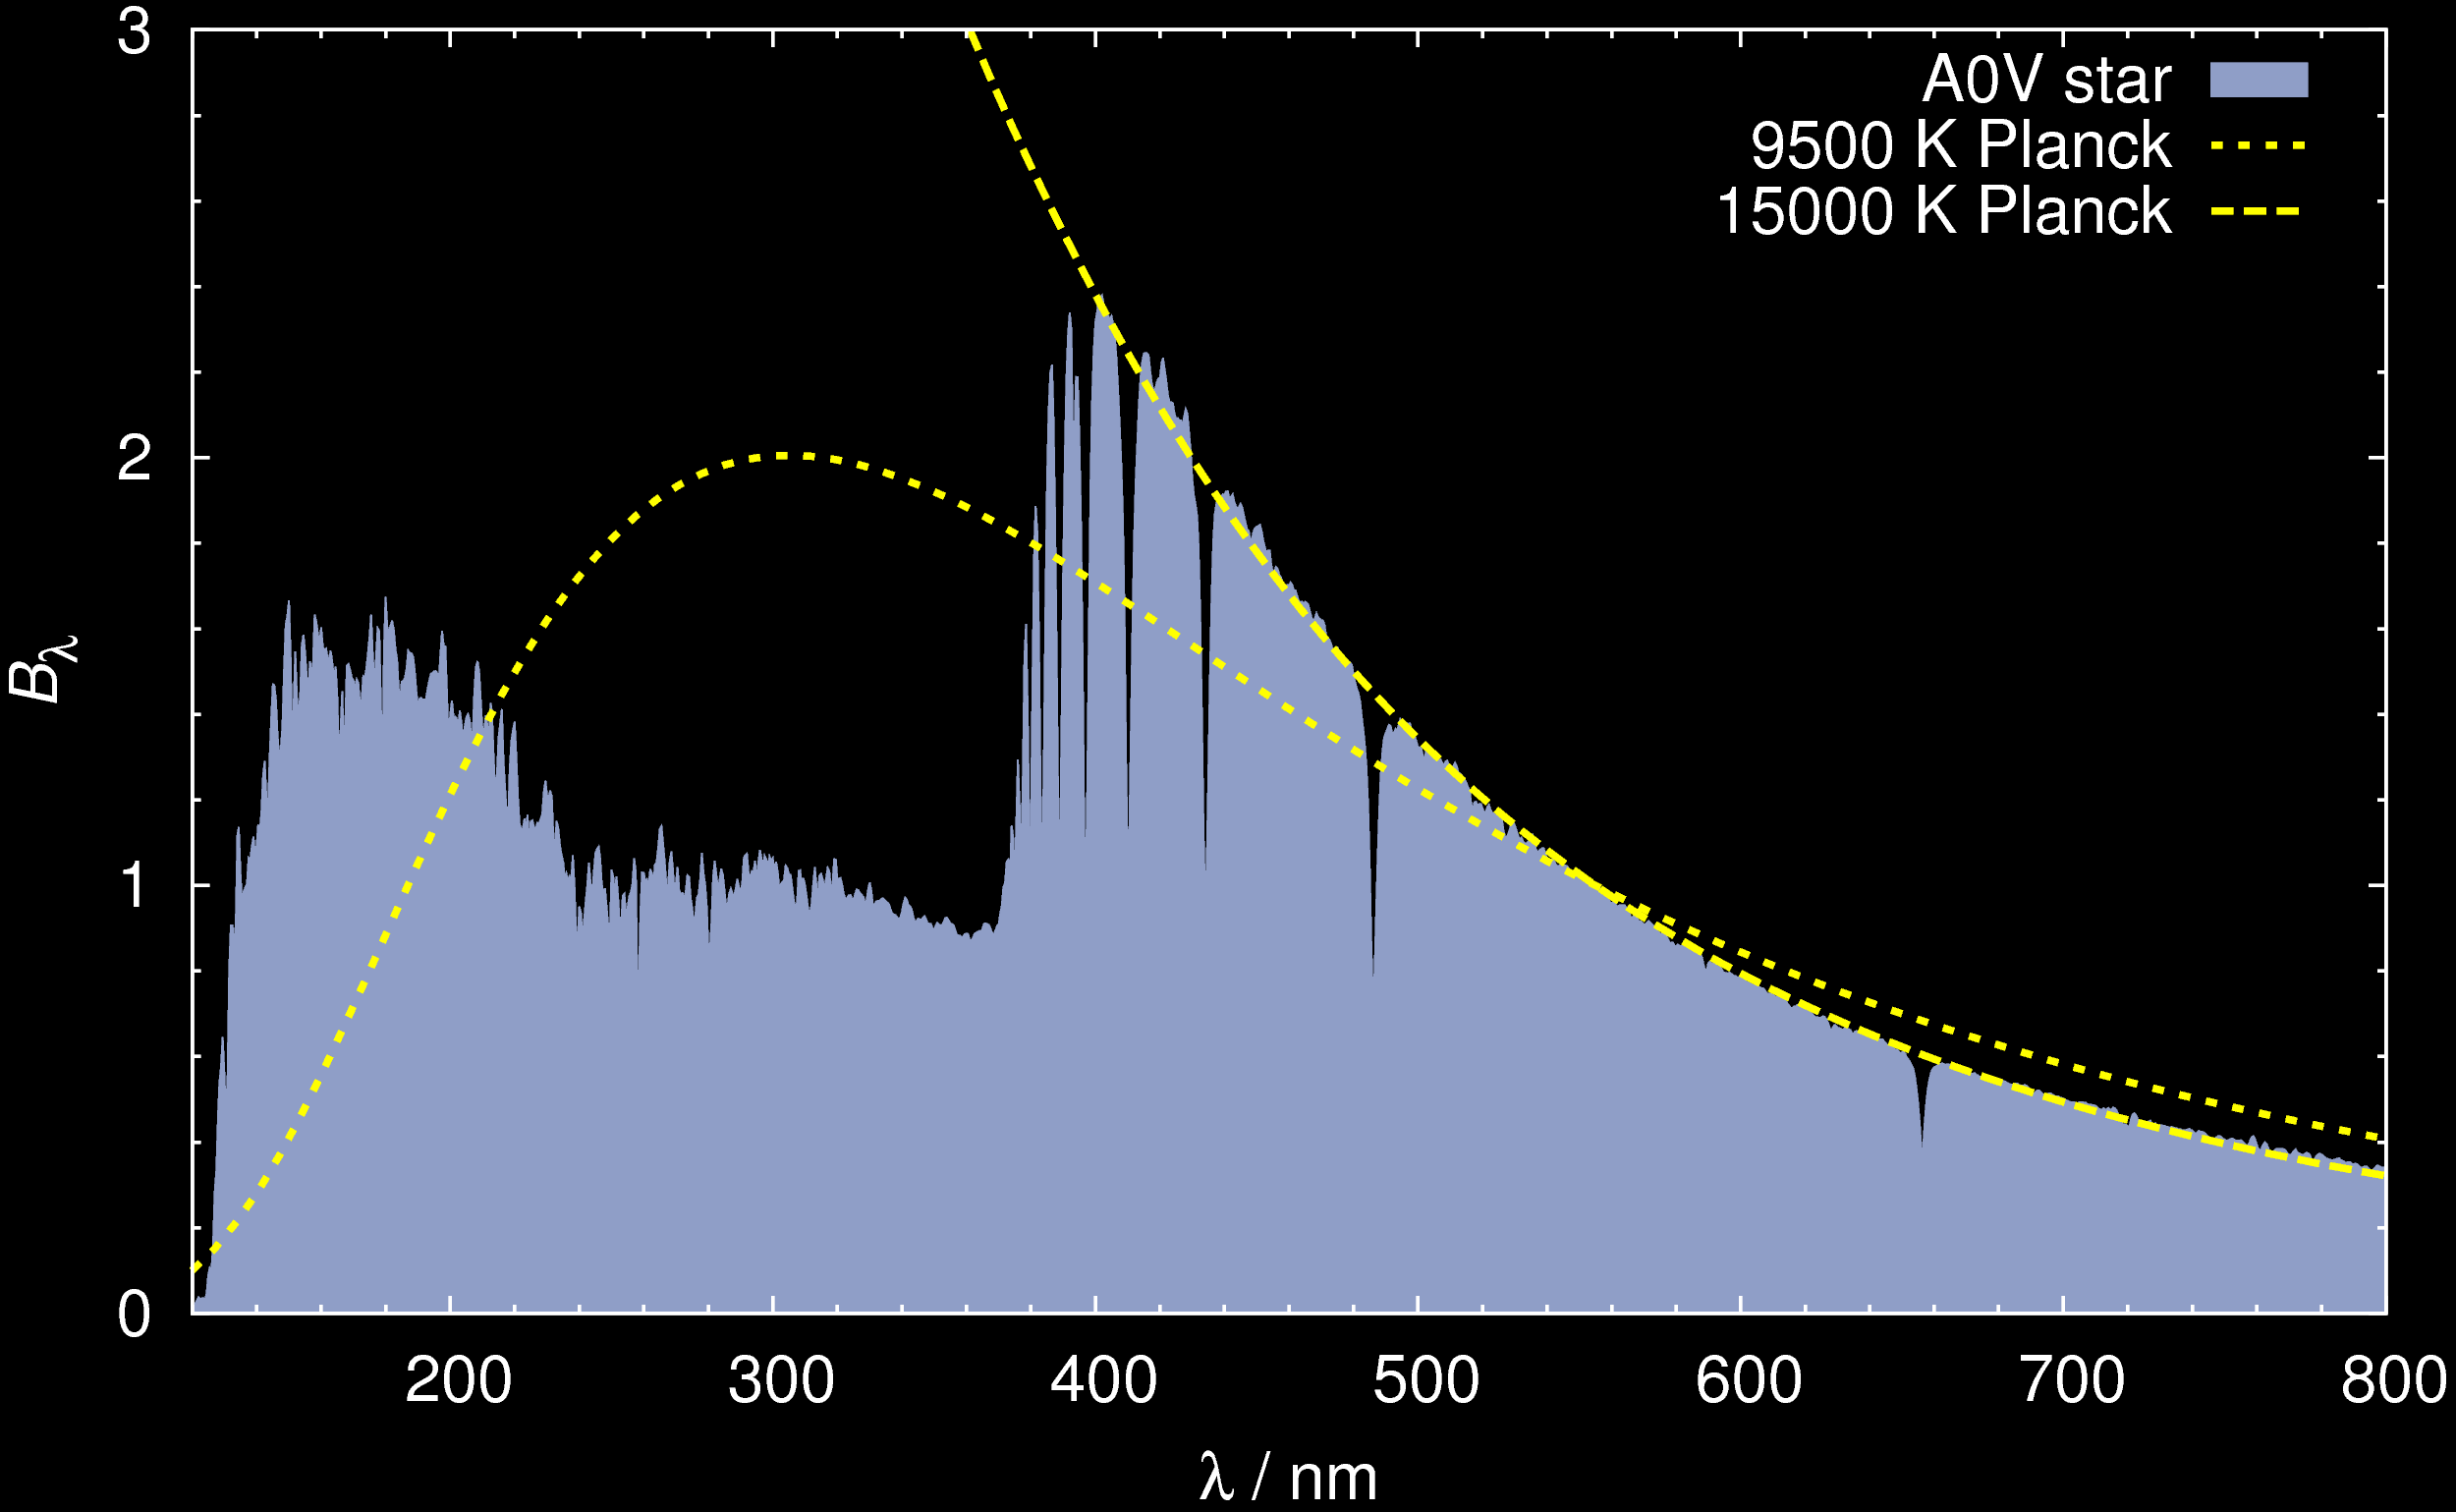
English:
The spectral power distribution of a typical A0V star (like e.g.
Vega
) from the
HILIB
stellar spectra library in comparison with a Planckian blackbody spectrum of the same effective temperature of 9500 K (dotted line) and visual color temperature of 15000 K (dashed line). Intensity
B
is in arbitrary units, and the curves are normalised to match at lambda = 555 nm. Both temperatures differ mainly due to the
Balmer
absoption bands in the ultraviolet region. This image has been inspired by figure 6.7 in the book "Der neue Kosmos" by A. Unsöld and B. Baschek, Springer Berlin, Heidelberg, New York, 6th edition 1999.
ISBN
3-540-64165-3
. Created with gnuplot.
|
| Date | |
| Source | Own work |
| Author | SiriusB |
Licensing
I, the copyright holder of this work, hereby publish it under the following license:
This file is licensed under the
Creative Commons
Attribution 3.0 Unported
license.
-
You are free:
- to share – to copy, distribute and transmit the work
- to remix – to adapt the work
-
Under the following conditions:
- attribution – You must give appropriate credit, provide a link to the license, and indicate if changes were made. You may do so in any reasonable manner, but not in any way that suggests the licensor endorses you or your use.