2005gdpServices.png
Size of this preview:
800 × 351 pixels
.
Other resolutions:
320 × 140 pixels
|
640 × 281 pixels
|
1,425 × 625 pixels
.
| Description |
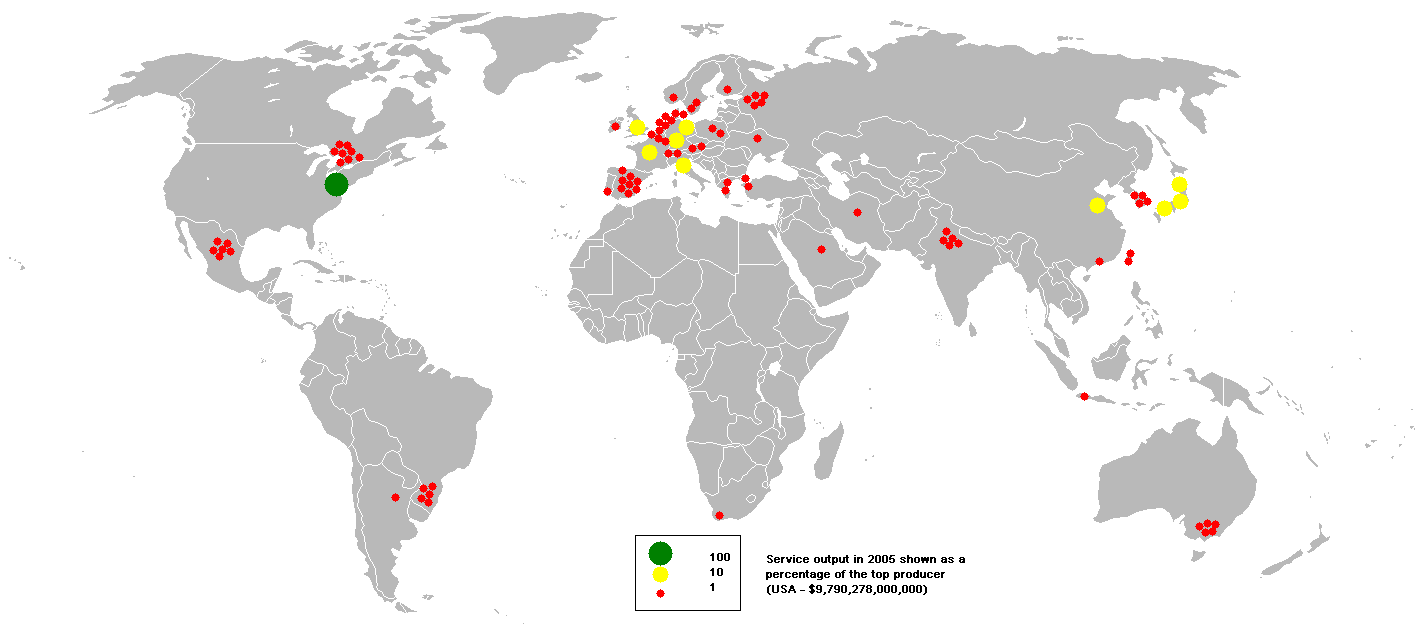
This bubble map shows the global distribution of output of value-added services in 2005 as a percentage of the the top producer (USA - $9,790,278,000,000). This map is consistent with incomplete set of data too as long as the top producer is known. It resolves the accessibility issues faced by colour-coded maps that may not be properly rendered in old computer screens. Data was extracted on 31st May 2007. Source - https://www.cia.gov/library/publications/the-world-factbook/fields/2012.html |
||
| Date | 01-03-2008 (original upload date) | ||
| Source | Based on File:BlankMap-World.png ; created by Anwar saadat on en.wikipedia ; transfered to Commons | ||
| Author | Anwar saadat | ||
|
Permission
( Reusing this file ) |
|
Original upload log
The original description page was
here
. All following user names refer to en.wikipedia.
- 2008-03-01 20:47 Bogdan 1425×625× (60643 bytes) +Ukraine
- 2007-05-31 17:39 Anwar saadat 1425×625× (60613 bytes)