Timeline_of_the_2023_Pacific_hurricane_season
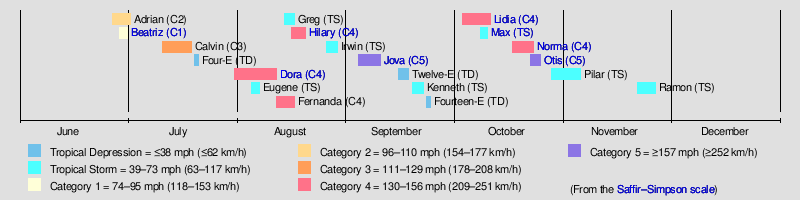
The 2023 Pacific hurricane season was a fairly active Pacific hurricane season. In the eastern Pacific basin (east of 140°W), 17 named storms formed; 10 of those became hurricanes, and 8 further intensified into major hurricanes (category 3 or higher on the 5-level Saffir–Simpson wind speed scale). In the central Pacific basin (between 140°W and the International Date Line), no tropical cyclones formed (for the fourth consecutive season), though four entered into the basin from the east.[1][2] The season officially began on May 15, 2023, in the eastern Pacific, and on June 1 in the central Pacific; it ended in both on November 30. These dates, adopted by convention, historically describe the period in each year when most tropical cyclogenesis occurs in these regions of the Pacific.[3] The season's first system, Tropical Storm Adrian, developed on June 27, and its last, Tropical Storm Ramon, dissipated on November 26.
| Timeline of the 2023 Pacific hurricane season | |||||||
|---|---|---|---|---|---|---|---|
 Season summary map | |||||||
| Season boundaries | |||||||
| First system formed | June 27, 2023 | ||||||
| Last system dissipated | November 26, 2023 | ||||||
| Strongest system | |||||||
| Name | Otis | ||||||
| Maximum winds | 165 mph (270 km/h) | ||||||
| Lowest pressure | 922 mbar (hPa; 27.23 inHg) | ||||||
| Longest lasting system | |||||||
| Name | Dora | ||||||
| Duration | 11.5[nb 1] days | ||||||
| |||||||
| Other years 2021, 2022, 2023, 2024, 2025 | |||||||
This timeline documents tropical cyclone formations, strengthening, weakening, landfalls, extratropical transitions, and dissipations during the season. It includes information that was not released throughout the season, meaning that data from post-storm reviews by the National Hurricane Center, such as a storm that was not initially warned upon, has been included.
By convention, meteorologists use one time zone when issuing forecasts and making observations: Coordinated Universal Time (UTC), and also use the 24-hour clock (where 00:00 = midnight UTC).[4] Tropical cyclone advisories in the Eastern North Pacific basin use both UTC and the nautical time zone where the center of the tropical cyclone is currently located. Time zones utilized (east to west) are: Central, Mountain, Pacific and Hawaii. In this timeline, all information is listed by UTC first, with the respective regional time zone included in parentheses. Additionally, figures for maximum sustained winds and position estimates are rounded to the nearest 5 units (knots, miles, or kilometers), following National Hurricane Center practice. Direct wind observations are rounded to the nearest whole number. Atmospheric pressures are listed to the nearest millibar and nearest hundredth of an inch of mercury.
May
- No tropical cyclones form in the Eastern Pacific basin during the month of May.
May 15
- The Eastern Pacific hurricane season officially begins.[3]
June
June 1
- The Central Pacific hurricane season officially begins.[3]
June 27
- 12:00 UTC (6:00 a.m. MDT) at 15.2°N 104.5°W / 15.2; -104.5 – A tropical depression forms from a tropical wave about 290 mi (465 km) south of Manzanillo, Colima.[5]
- 18:00 UTC (12:00 p.m. MDT) at 15.2°N 104.5°W / 15.2; -104.5 – The tropical depression strengthens into Tropical Storm Adrian about 290 mi (465 km) south of Manzanillo.[5]
June 28
- 12:00 UTC (6:00 a.m. MDT) at 15.2°N 107.6°W / 15.2; -107.6 – Tropical Storm Adrian strengthens into a Category 1 hurricane about 385 mi (620 km) southwest of Manzanillo.[5]
June 29
- 06:00 UTC (1:00 a.m. CDT) at 13.8°N 97.3°W / 13.8; -97.3 – Tropical Depression Two‑E forms from a tropical wave[nb 2] about 240 mi (390 km) southeast of Acapulco, Guerrero.[nb 3][6]
- 12:00 UTC (7:00 a.m. CDT) at 14.3°N 98.2°W / 14.3; -98.2 – Tropical Depression Two‑E strengthens into Tropical Storm Beatriz about 205 mi (335 km) south-southeast of Acapulco.[6]
June 30
- 06:00 UTC (12:00 a.m. MDT) at 16.7°N 111.4°W / 16.7; -111.4 – Hurricane Adrian intensifies to Category 2 strength about 540 mi (870 km) west-southwest of Manzanillo.[5]
- 12:00 UTC (6:00 a.m. MDT) at 17.0°N 111.9°W / 17.0; -111.9 – Hurricane Adrian reaches peak intensity with maximum sustained winds of 105 mph (165 km/h) and a minimum central pressure of 970 mbar (28.64 inHg), about 565 mi (905 km) west-southwest of Manzanillo.[5]
- 12:00 UTC (7:00 a.m. CDT) at 16.8°N 101.8°W / 16.8; -101.8 – Tropical Storm Beatriz strengthens into a Category 1 hurricane about 195 mi (315 km) southeast of Manzanillo, Colima.[6]
- 18:00 UTC (4:00 p.m. CDT) at 17.5°N 102.7°W / 17.5; -102.7 – Hurricane Beatriz reaches peak intensity with maximum sustained winds of 85 mph (140 km/h) and a minimum central pressure of 992 mbar (29.29 inHg), about 115 mi (185 km) southeast of Manzanillo.[6]
July
July 1
- 00:00 UTC (6:00 p.m. MDT, June 30) at 17.6°N 113.1°W / 17.6; -113.1 – Hurricane Adrian weakens to Category 1 strength about 635 mi (1,020 km) west-southwest of Manzanillo.[5]
- 06:00 UTC (1:00 a.m. CDT) at 19.2°N 104.6°W / 19.2; -104.6 – Hurricane Beatriz weakens to a tropical storm while making landfall 5 mi (10 km) west of Manzanillo International Airport with 65 mph (100 km/h) sustained winds, then quickly dissipates.[6]
- 12:00 UTC (6:00 a.m. MDT) at 18.2°N 114.2°W / 18.2; -114.2 – Hurricane Adrian weakens to a tropical storm about 695 mi (1,120 km) west of Manzanillo.[5]
July 2
- 12:00 UTC (5:00 a.m. PDT) at 19.4°N 116.4°W / 19.4; -116.4 – Tropical Storm Adrian degenerates into a remnant low about 835 mi (1,345 km) west-northwest of Manzanillo, and subsequently dissipates.[5]
July 11
- 06:00 UTC (12:00 a.m. MDT) at 11.7°N 104.2°W / 11.7; -104.2 – Tropical Storm Calvin forms from a disturbance in the eastern Pacific monsoon trough about 450 mi (720 km) south-southwest of Zihuatanejo, Guerrero.[8]
July 13
- 12:00 UTC (2:00 a.m. HST) at 12.5°N 116.6°W / 12.5; -116.6 – Tropical Storm Calvin strengthens into a Category 1 hurricane about 840 mi (1,350 km) southwest of the southern tip of the Baja California peninsula.[8]
July 14
- 00:00 UTC (2:00 p.m. HST, July 13) at 13.0°N 119.7°W / 13.0; -119.7 – Hurricane Calvin intensifies to Category 2 strength about 940 mi (1,510 km) southwest of the southern tip of the Baja California peninsula.[8]
- 12:00 UTC (2:00 a.m. HST) at 13.4°N 122.6°W / 13.4; -122.6 – Hurricane Calvin intensifies to Category 3 strength about 1,060 mi (1,705 km) southwest of the southern tip of the Baja California peninsula.[8]
- 18:00 UTC (8:00 a.m. HST) at 13.7°N 123.9°W / 13.7; -123.9 – Hurricane Calvin reaches peak intensity with maximum sustained winds of 125 mph (205 km/h) and a minimum central pressure of 953 mbar (28.14 inHg), about 1,115 mi (1,795 km) west-southwest of the southern tip of the Baja California Peninsula.[8]
July 15
- 06:00 UTC (8:00 p.m. HST, July 14) at 14.4°N 126.7°W / 14.4; -126.7 – Hurricane Calvin weakens to Category 2 strength about 1,310 mi (2,110 km) west-southwest of the southern tip of the Baja California peninsula.[8]
July 16
- 00:00 UTC (2:00 p.m. HST, July 15) at 15.2°N 131.2°W / 15.2; -131.2 – Hurricane Calvin weakens to Category 1 strength about 1,635 mi (2,630 km) southeast of Ka Lae, the southernmost point of the Big Island of Hawaii.[8]
- 18:00 UTC (8:00 a.m. HST) at 16.0°N 135.6°W / 16.0; -135.6 – Hurricane Calvin weakens to a tropical storm about 1,340 mi (2,160 km) southeast of Ka Lae.[8]
July 17
- 12:00 UTC (2:00 a.m. HST) at 16.7°N 140.5°W / 16.7; -140.5 – Tropical Storm Calvin enters the Central Pacific basin about 1,015 mi (1,630 km) southeast of Ka Lae.[8]
July 19
- 18:00 UTC (8:00 a.m. HST) at 17.9°N 157.7°W / 17.9; -157.7 – Tropical Storm Calvin degenerates into a remnant low about 150 mi (240 km) southwest of Ka Lae, and later dissipates.[8]
July 20
- 12:00 UTC (5:00 a.m. PDT) at 12.8°N 119.6°W / 12.8; -119.6 – Tropical Depression Four‑E forms.[9]
July 22
- 00:00 UTC (5:00 p.m. PDT, July 21) at 16.0°N 126.1°W / 16.0; -126.1 – Tropical Depression Four‑E degenerates into a remnant low.[9]
July 31
- 18:00 UTC (1:00 p.m. CDT) at 14.8°N 103.7°W / 14.8; -103.7 – Tropical Depression Five‑E forms from a tropical wave about 290 mi (465 km) south of Manzanillo, Colima.[10]
August
August 1
- 09:00 UTC (3:00 a.m. MDT) at 16.0°N 107.1°W / 16.0; -107.1 – Tropical Depression Five‑E strengthens into Tropical Storm Dora about 275 mi (445 km) southwest of Manzanillo.[11]
August 2
- 03:00 UTC (5:00 p.m. HST, August 1) at 16.2°N 111.5°W / 16.2; -111.5 – Tropical Storm Dora strengthens into a Category 1 hurricane about 510 mi (820 km) west-southwest of Manzanillo.[12]
- 15:00 UTC (5:00 a.m. HST) at 15.6°N 114.2°W / 15.6; -114.2 – Hurricane Dora intensifies to Category 2 strength about 575 mi (925 km) south-southwest of the southern tip of the Baja California peninsula.[13]
August 3
- 03:00 UTC (5:00 p.m. HST, August 2) at 15.2°N 116.9°W / 15.2; -116.9 – Hurricane Dora intensifies to Category 3 strength about 700 mi (1,125 km) southwest of the southern tip of the Baja California peninsula.[14]
- 09:00 UTC (11:00 p.m. HST, August 2) at 15.0°N 118.5°W / 15.0; -118.5 – Hurricane Dora intensifies to Category 4 strength about 780 mi (1,255 km) southwest of the southern tip of the Baja California peninsula.[15]
- 15:00 UTC (5:00 a.m. HST) at 14.7°N 120.1°W / 14.7; -120.1 – Hurricane Dora weakens to Category 3 strength about 875 mi (1,410 km) southwest of the southern tip of the Baja California peninsula.[16]
August 4
- 01:00 UTC (3:00 p.m. HST, August 3) at 14.2°N 122.9°W / 14.2; -122.9 – Hurricane Dora re-intensifies to Category 4 strength about 1,035 mi (1,665 km) southwest of the southern tip of the Baja California peninsula.[17]
- 15:00 UTC (5:00 a.m. HST) at 14.0°N 126.9°W / 14.0; -126.9 – Hurricane Dora weakens to Category 3 strength about 1,270 mi (2,045 km) west-southwest of the southern tip of the Baja California peninsula.[18]
- 21:00 UTC (11:00 a.m. HST) at 13.8°N 128.5°W / 13.8; -128.5 – Hurricane Dora weakens to Category 2 strength about 1,370 mi (2,205 km) west-southwest of the southern tip of the Baja California peninsula.[19]
August 5
- 12:00 UTC (6:00 a.m. MDT) at 17.9°N 106.3°W / 17.9; -106.3 – Tropical Depression Six‑E forms from a tropical wave.[20]
- 15:00 UTC (5:00 a.m. HST) at 13.3°N 133.3°W / 13.3; -133.3 – Hurricane Dora re-intensifies to Category 3 strength about 1,535 mi (2,470 km) east of Ka Lae, Hawaii.[21]
- 18:00 UTC (12:00 p.m. MDT) at 18.7°N 107.3°W / 18.7; -107.3 – Tropical Depression Six‑E strengthens into Tropical Storm Eugene.[20]
- 21:00 UTC (11:00 a.m. HST) at 13.3°N 134.8°W / 13.3; -134.8 – Hurricane Dora further re-intensifies to Category 4 strength about 1,440 mi (2,315 km) east-southeast of Ka Lae.[22]
August 6
- 03:00 UTC (5:00 p.m. HST, August 5) at 13.2°N 136.5°W / 13.2; -136.5 – Hurricane Dora reaches peak intensity with maximum sustained winds of 145 mph (230 km/h) and a minimum central pressure of 942 mbar (27.82 inHg), about 1,335 mi (2,150 km) east-southeast of Ka Lae.[23]
- 12:00 UTC (6:00 a.m. MDT) at 21.3°N 110.6°W / 21.3; -110.6 – Tropical Storm Eugene reaches peak intensity with maximum sustained winds of 70 mph (110 km/h) and a minimum central pressure of 992 mbar (29.29 inHg).[20]
- 15:00 UTC (5:00 a.m. HST) at 13.0°N 140.1°W / 13.0; -140.1 – Hurricane Dora enters the Central Pacific basin about 1,115 mi (1,795 km) east-southeast of Ka Lae.[24]
August 7
- 12:00 UTC (11:00 a.m. PDT) at 24.3°N 124.5°W / 24.3; -124.5 – Tropical Storm Eugene degenerates into a remnant low.[20]
August 10
- 12:00 UTC (2:00 a.m. HST) at 12.1°N 170.5°W / 12.1; -170.5 – Hurricane Dora weakens to Category 3 strength[10] south of Johnston Atoll.[25]
August 11
- 18:00 UTC (8:00 a.m. HST) at 14.8°N 178.6°W / 14.8; -178.6 – Hurricane Dora weakens to Category 2 strength.[10]
August 12
- 00:00 UTC (09:00 JST) at 15.6°N 179.8°W / 15.6; -179.8 – Hurricane Dora briefly re-intensifies to Category 3 strength very near the International Date Line; upon crossing Date Line, Dora exits the Central Pacific basin and is redesignated as a typhoon.[10][26]
- 12:00 UTC (6:00 a.m MDT) at 14.2°N 111.8°W / 14.2; -111.8 – Tropical Depression Seven‑E forms from a tropical wave.[27]
August 13
- 00:00 UTC (6:00 p.m. MDT, August 12) at 15.0°N 113.6°W / 15.0; -113.6 – Tropical Depression Seven‑E strengthens into Tropical Storm Fernanda.[27]
- 18:00 UTC (11:00 p.m. PDT) at 15.3°N 116.1°E / 15.3; 116.1 – Tropical Storm Fernanda strengthens into a Category 1 hurricane.[27]
August 14
- 00:00 UTC (2:00 p.m. HST, August 13) at 15.4°N 116.8°W / 15.4; -116.8 – Hurricane Fernanda intensifies to Category 2 strength.[27]
- 00:00 UTC (2:00 p.m. HST, August 13) at 11.3°N 138.2°W / 11.3; -138.2 – Tropical Depression Eight‑E forms.[28]
- 06:00 UTC (8:00 p.m. HST, August 13) at 15.5°N 117.4°W / 15.5; -117.4 – Hurricane Fernanda intensifies to Category 2 strength.[27]
- 06:00 UTC (8:00 p.m. HST, August 13) at 11.3°N 139.2°W / 11.3; -139.2 – Tropical Depression Eight‑E strengthens into Tropical Storm Greg, then later enters the Central Pacific basin.[28]
- 06:00 UTC (8:00 p.m. HST, August 13) at 15.5°N 117.4°W / 15.5; -117.4 – Hurricane Fernanda intensifies to Category 3 strength.[27]
- 12:00 UTC (2:00 a.m. HST) at 15.6°N 118.0°W / 15.6; -118.0 – Hurricane Fernanda intensifies to Category 4 strength and simultaneously reaches peak intensity with maximum sustained winds of 130 mph (215 km/h) and a minimum central pressure of 949 mbar (28.02 inHg).[27]
August 15
- 00:00 UTC (2:00 p.m. HST, August 14) at 16.5°N 119.4°W / 16.5; -119.4 – Hurricane Fernanda weakens to Category 3 strength.[27]
- 06:00 UTC (8:00 p.m. HST, August 14) at 11.1°N 144.0°W / 11.1; -144.0 – Tropical Storm Greg reaches peak intensity with maximum sustained winds of 50 mph (85 km/h) and a minimum central pressure of 1,000 mbar (29.53 inHg) southeast of Hilo, Hawaii.[28]
- 12:00 UTC (2:00 a.m. HST) at 16.8°N 121.2°W / 16.8; -121.2 – Hurricane Fernanda weakens to Category 2 strength.[27]
August 16
- 06:00 UTC (8:00 p.m. HST, August 15) at 17.2°N 124.8°W / 17.2; -124.8 – Hurricane Fernanda weakens to Category 1 strength.[27]
- 06:00 UTC (1:00 a.m. CDT) at 11.9°N 100.8°W / 11.9; -100.8 – A tropical depression forms from a tropical wave about 345 mi (555 km) south of Acapulco, Guerrero.[29]
- 12:00 UTC (2:00 a.m. HST) at 17.0°N 126.1°W / 17.0; -126.1 – Hurricane Fernanda weakens to a tropical storm.[27]
- 12:00 UTC (7:00 a.m. CDT) at 12.6°N 102.3°W / 12.6; -102.3 – The tropical depression strengthens into Tropical Storm Hilary about 335 mi (535 km) southwest of Acapulco.[29]
August 17
- 06:00 UTC (9:00 p.m. HST, August 16) at 16.5°N 129.9°W / 16.5; -129.9 – Tropical Storm Fernanda degenerates into a remnant low, and subsequently dissipates.[27]
- 12:00 UTC (6:00 a.m. MDT) at 15.2°N 107.2°W / 15.2; -107.2 – Tropical Storm Hilary strengthens into a Category 1 hurricane about 330 mi (530 km) southwest of Manzanillo, Colima.[29]
- 18:00 UTC (12:00 p.m. MDT) at 15.8°N 108.4°W / 15.8; -108.4 – Hurricane Hilary intensifies to Category 2 strength.[29]
- 18:00 UTC (8:00 a.m. HST) at 12.2°N 156.3°W / 12.2; -156.3 – Tropical Storm Greg weakens to a tropical depression south of the island of Hawaii, and later degenerates into a remnant low.[28]
August 18
- 00:00 UTC (6:00 p.m. MDT, August 17, 2023) at 16.4°N 109.5°W / 16.4; -109.5 – Hurricane Hilary intensifies to Category 3 strength.[29]
- 06:00 UTC (12:00 a.m. MDT) at 16.8°N 110.4°W / 16.8; -110.4 – Hurricane Hilary intensifies to Category 4 strength and simultaneously reaches peak intensity with maximum sustained winds of 140 mph (220 km/h) and a minimum central pressure of 940 mbar (27.76 inHg), about 430 mi (695 km) west-southwest of Manzanillo.[29]
- 18:00 UTC (12:00 p.m. MDT) at 18.2°N 111.9°W / 18.2; -111.9 – Hurricane Hilary weakens to Category 3 strength[29] about 60 mi (110 km) west-southwest of Socorro Island.[30]
August 19
- 00:00 UTC (6:00 p.m. MDT, August 18) at 19.2°N 113.5°W / 19.2; -113.5 – Hurricane Hilary re-strengthens to Category 4 strength.[29]
- 12:00 UTC (6:00 a.m. MDT) at 22.9°N 113.9°W / 22.9; -113.9 – Hurricane Hilary weakens to Category 3 strength.[29]
- 18:00 UTC (12:00 p.m. MDT) at 22.9°N 113.9°W / 22.9; -113.9 – Hurricane Hilary weakens to Category 2 strength[29] about 350 mi (570 km) south-southeast of Punta Eugenia, Baja California Sur.[31]
August 20
- 00:00 UTC (6:00 p.m. MDT, August 19) at 24.3°N 115.3°W / 24.3; -115.3 – Hurricane Hilary weakens to Category 1 strength.[29]
- 12:00 UTC (5:00 a.m. PDT) at 28.1°N 115.3°W / 28.1; -115.3 – Hurricane Hilary weakens to a tropical storm near Isla Cedros, about 25 mi (35 km) northwest of Punta Eugenia.[29]
- 17:00 UTC (10:00 a.m. PDT) at 29.7°N 115.6°W / 29.7; -115.6 – Tropical Storm Hilary makes landfall with sustained winds of 60 mph (95 km/h) near San Fernando, Baja California.[29]
- 21:00 UTC (2:00 p.m. PDT) at 31.4°N 115.6°W / 31.4; -115.6 – Tropical Storm Hilary degenerates to a post-tropical cyclone inland over northern Baja California, and is soon absorbed by a non-tropical low.[29]
August 26
- 18:00 UTC (8:00 a.m. HST) at 15.5°N 117.9°W / 15.5; -117.9 – Tropical Depression Ten‑E forms from a tropical wave in the west-central eastern Pacific.[32]
August 27
- 12:00 UTC (2:00 a.m. HST) at 16.6°N 120.0°W / 16.6; -120.0 – Tropical Depression Ten‑E strengthens into Tropical Storm Irwin.[32]
August 29
- 00:00 UTC (2:00 p.m. HST, August 28) at 19.1°N 125.0°W / 19.1; -125.0 – Tropical Storm Irwin reaches peak intensity with maximum sustained winds of 45 mph (75 km/h) and a minimum central pressure of 998 mbar (29.47 inHg).[32]
- 12:00 UTC (2:00 a.m. HST) at 19.7°N 128.1°W / 19.7; -128.1 – Tropical Storm Irwin degenerates to a remnant low, and subsequently dissipates.[32]
September
September 4
- 18:00 UTC (1:00 p.m. CDT) at 12.3°N 103.8°W / 12.3; -103.8 – Tropical Depression Eleven‑E forms over the eastern Pacific from a tropical wave.[33]
September 5
- 06:00 UTC (12:00 a.m. MDT) at 12.4°N 105.9°W / 12.4; -105.9 – Tropical Depression Eleven‑E strengthens into Tropical Storm Jova[33] far to the south-southeast of the southern tip of the Baja California peninsula.[34]
September 6
- 06:00 UTC (12:00 a.m. MDT) at 13.3°N 109.0°W / 13.3; -109.0 – Tropical Storm Jova strengthens into a Category 1 hurricane.[33]
- 12:00 UTC (6:00 a.m. MDT) at 13.9°N 110.0°W / 13.9; -110.0 – Hurricane Jova intensifies to Category 2 strength.[33]
- 18:00 UTC (12:00 p.m. MDT) at 14.6°N 111.1°W / 14.6; -111.1 – Hurricane Jova intensifies to Category 4 strength.[33]
September 7
- 00:00 UTC (6:00 p.m. MDT, September 6) at 15.3°N 112.4°W / 15.3; -112.4 – Hurricane Jova intensifies to Category 5 strength and simultaneously reaches peak intensity with maximum sustained winds of 160 mph (260 km/h) and minimum central pressure of 926 mbar (25 inHg).[33]
- 12:00 UTC (6:00 a.m. PDT) at 16.8°N 115.0°W / 16.8; -115.0 – Hurricane Jova weakens to Category 4 strength.[33]
September 8
- 06:00 UTC (11:00 p.m. PDT, September 7) at 18.8°N 119.1°W / 18.8; -119.1 – Hurricane Jova weakens to Category 3 strength.[33]
- 12:00 UTC (5:00 a.m. PDT) at 19.5°N 120.6°W / 19.5; -120.6 – Hurricane Jova weakens to Category 2 strength.[33]
- 18:00 UTC (11:00 a.m. PDT) at 20.1°N 121.9°W / 20.1; -121.9 – Hurricane Jova weakens to Category 1 strength.[33]
September 9
- 06:00 UTC (11:00 p.m. PDT, September 8) at 21.2°N 124.2°W / 21.2; -124.2 – Hurricane Jova weakens to a tropical storm.[33]
September 10
- 06:00 UTC (11:00 p.m. PDT, September 9) at 23.8°N 126.6°W / 23.8; -126.6 – Tropical Storm Jova degenerates into a remnant low.[33]
September 15
- 12:00 UTC (2:00 a.m. HST) at 15.0°N 135.3°W / 15.0; -135.3 – Tropical Depression Twelve‑E forms from a tropical wave.[35]
September 18
- 06:00 UTC (8:00 p.m. HST, September 17) at 12.3°N 146.5°W / 12.3; -146.5 – Tropical Depression Twelve‑E degenerates to a remnant low far southeast of the Big Island of Hawaii, and later dissipates.[35]
September 19
- 06:00 UTC (11:00 p.m. PDT, September 18) at 14.4°N 117.5°W / 14.4; -117.5 – Tropical Depression Thirteen‑E forms southwest of the southern tip of the Baja California peninsula.[36]
- 12:00 UTC (5:00 a.m. PDT) at 14.7°N 118.8°W / 14.7; -118.8 – Tropical Depression Thirteen‑E strengthens into Tropical Storm Kenneth southwest of the southern tip of the Baja California peninsula.[36]
September 21
- 00:00 UTC (5:00 p.m. PDT, September 20) at 16.3°N 124.5°W / 16.3; -124.5 – Tropical Storm Kenneth reaches peak intensity with maximum sustained winds of 50 mph (85 km/h) and a minimum central pressure of 1000 mbar (29.53 inHg), west-southwest of the southern tip of the Baja California peninsula.[36]
September 22
- 06:00 UTC (11:00 p.m. PDT, September 21) at 18.8°N 126.1°W / 18.8; -126.1 – Tropical Storm Kenneth weakens to a tropical depression west of the southern tip of the Baja California peninsula.[36]
- 12:00 UTC (5:00 a.m. PDT) at 20.0°N 125.9°W / 20.0; -125.9 – Tropical Depression Kenneth degenerates to a remnant low west of the southern tip of the Baja California peninsula, and subsequently dissipates.[36]
September 23
- 12:00 UTC (5:00 a.m. PDT) at 13.6°N 118.5°W / 13.6; -118.5 – Tropical Depression Fourteen‑E forms from a tropical wave about 865 mi (1,390 km) southwest of the southern tip of the Baja California peninsula.[37]
September 25
- 00:00 UTC (5:00 p.m. PDT, September 24) at 15.1°N 125.9°W / 15.1; -125.9 – Tropical Depression Fourteen‑E degenerates into a remnant low about 1,370 mi (2,205 km) southwest of the southern tip of the Baja California peninsula.[37]
October
October 3
- 00:00 UTC (6:00 p.m. MDT, October 2) at 11.2°N 105.8°W / 11.2; -105.8 – A tropical depression forms from a tropical wave about 575 mi (925 km) south of Manzanillo, Colima.[38]
- 06:00 UTC (12:00 a.m. MDT) at 11.5°N 106.4°W / 11.5; -106.4 – The tropical depression strengthens into Tropical Storm Lidia about 530 mi (850 km) south of Manzanillo.[38]
October 8
- 18:00 UTC (1:00 p.m. CDT) at 15.5°N 101.5°W / 15.5; -101.5 – Tropical Depression Sixteen‑E forms about 145 mi (230 km) south of Zihuatanejo, Guerrero.[nb 4][40]
October 9
- 00:00 UTC (7:00 p.m. CDT, October 8) at 16.1°N 101.6°W / 16.1; -101.6 – Tropical Depression Sixteen‑E strengthens into Tropical Storm Max about 105 mi (165 km) south of Zihuatanejo.[40]
- 18:00 UTC (12:00 p.m. MDT) at 17.8°N 111.4°W / 17.8; -111.4 – Tropical Storm Lidia strengthens into a Category 1 hurricane about 445 mi (715 km) southwest of Puerto Vallarta, Jalisco.[38]
- 18:00 UTC (1:00 p.m. CDT) at 17.3°N 101.1°W / 17.3; -101.1 – Tropical Storm Max reaches peak intensity with maximum sustained winds of 70 mph (110 km/h) and a minimum central pressure of 990 mbar (29.23 inHg), and simultaneously makes landfall near Puerto Vicente, Guerrero.[40]
October 10
- 00:00 UTC (7:00 p.m. CDT, October 9) at 17.9°N 100.8°W / 17.9; -100.8 – Tropical Storm Max weakens inland to 40 mph (65 km/h) and soon dissipates.[40]
- 18:00 UTC (12:00 p.m. MDT) at 19.3°N 107.1°W / 19.3; -107.1 – Hurricane Lidia intensifies to Category 3 strength about 150 mi (240 km) southwest of Puerto Vallarta.[38]
October 11
- 00:00 UTC (6:00 p.m. MDT, October 10) at 20.1°N 105.5°W / 20.1; -105.5 – Hurricane Lidia intensifies to Category 4 strength and simultaneously reaches peak intensity with maximum sustained winds of 140 mph (220 km/h) and a minimum central pressure of 942 mbar (27.82 inHg), together with making landfall near Las Peñitas, Jalisco, about 40 mi (65 km) southwest of Puerto Vallarta.[38]
- 06:00 UTC (1:00 a.m. CDT) at 21.7°N 103.5°W / 21.7; -103.5 – Hurricane Lidia weakens to a tropical storm inland[38] about 85 miles (140 km) north of Guadalajara, Jalisco.[41]
- 12:00 UTC (7:00 a.m. CDT) at 24.5°N 100.5°W / 24.5; -100.5 – Tropical Storm Lidia degenerates into a remnant low inland over Northern Mexico, and later dissipates.[38]
October 17
- 12:00 UTC (6:00 a.m. MDT) at 12.7°N 105.8°W / 12.7; -105.8 – A tropical depression forms as a result of interaction between an area of convection within the eastern Pacific monsoon trough and a Tehuantepec gap wind event about 460 mi (740 km) south-southwest of Manzanillo, Colima.[42]
- 18:00 UTC (12:00 p.m. MDT) at 12.9°N 106.9°W / 12.9; -106.9 – The tropical depression strengthens into Tropical Storm Norma about 465 mi (750 km) south-southwest of Manzanillo.[42]
October 18
- 18:00 UTC (12:00 p.m. MDT) at 15.3°N 107.9°W / 15.3; -107.9 – Tropical Storm Norma strengthens into a Category 1 hurricane about 520 mi (835 km) south-southeast of Cabo San Lucas, Baja California Sur.[42]
October 19
- 06:00 UTC (12:00 a.m. MDT) at 16.4°N 107.8°W / 16.4; -107.8 – Hurricane Norma intensifies to Category 3 strength about 445 mi (715 km) south-southeast of Cabo San Lucas.[42]
- 12:00 UTC (6:00 a.m. MDT) at 16.9°N 107.7°W / 16.9; -107.7 – Hurricane Norma intensifies to Category 4 strength and simultaneously reaches peak intensity with maximum sustained winds of 130 mph (215 km/h) and a minimum central pressure of 939 mbar (27.73 inHg) about 405 mi (650 km) south-southeast of Cabo San Lucas.[42]
- 18:00 UTC (12:00 p.m. MDT) at 17.3°N 108.0°W / 17.3; -108.0 – Hurricane Norma weakens to Category 3 strength about 370 mi (595 km) south-southeast of Cabo San Lucas.[42]
October 21
- 12:00 UTC (6:00 a.m. MDT) at 22.3°N 110.2°W / 22.3; -110.2 – Hurricane Norma weakens to Category 2 strength about 50 mi (85 km) south-southwest of Cabo San Lucas.[42]
- 18:00 UTC (12:00 p.m. MDT) at 22.9°N 110.3°W / 22.9; -110.3 – Hurricane Norma weakens to Category 1 strength about 25 mi (35 km) west of Cabo San Lucas.[42]
- 20:15 UTC (2:15 p.m. MDT) at 23.0°N 110.1°W / 23.0; -110.1 – Hurricane Norma makes landfall with sustained winds of 80 mph (130 km/h) about 10 mi (20 km) west of Cabo San Lucas.[42]
October 22
- 00:00 UTC (6:00 p.m. MDT October 21) at 23.6°N 110.1°W / 23.6; -110.1 – Hurricane Norma weakens to a tropical storm inland about 45 mi (75 km) west-northwest of Cabo San Lucas.[42]
- 12:00 UTC (7:00 a.m. CDT) at 9.8°N 96.7°W / 9.8; -96.7 – Tropical Depression Eighteen‑E forms about 535 mi (860 km) south-southeast of Acapulco, Guerrero.[43]
- 21:00 UTC (4:00 p.m. CDT) at 10.2°N 96.9°W / 10.2; -96.9 – Tropical Depression Eighteen‑E strengthens into Tropical Storm Otis about 505 mi (815 km) south-southeast of Acapulco.[43]
October 23
- 10:30 UTC (4:30 a.m. MDT) at 24.7°N 108.0°W / 24.7; -108.0 – Tropical Storm Norma weakens to a tropical depression and makes landfall with sustained winds of 35 mph (55 km/h) near El Dorado, Sinaloa.[42]
- 12:00 UTC (6:00 a.m. MDT) at 24.7°N 107.9°W / 24.7; -107.9 – Tropical Depression Norma degenerates into a remnant low inland near El Dorado, and quickly dissipates.[42]
October 24
- 12:00 UTC (7:00 a.m. CDT) at 14.2°N 98.9°W / 14.2; -98.9 – Tropical Storm Otis strengthens into a Category 1 hurricane about 190 mi (305 km) south-southeast of Acapulco.[43]
- 18:00 UTC (1:00 p.m. CDT) at 14.9°N 99.4°W / 14.9; -99.4 – Hurricane Otis intensifies to Category 3 strength about 130 mi (215 km) south-southeast of Acapulco.[43]
October 25
- 00:00 UTC (7:00 p.m. CDT October 24) at 15.7°N 99.6°W / 15.7; -99.6 – Hurricane Otis intensifies to Category 4 strength about 85 mi (140 km) south-southeast of Acapulco.[43]
- 03:00 UTC (10:00 p.m. CDT October 24) at 16.1°N 99.7°W / 16.1; -99.7 – Hurricane Otis intensifies to Category 5 strength and simultaneously reaches peak intensity with maximum sustained winds of 165 mph (270 km/h) and a minimum central pressure of 922 mbar (27.23 inHg) about 60 mi (95 km) south-southeast of Acapulco.[43]
- 06:45 UTC (1:45 a.m. CDT) at 16.8°N 99.9°W / 16.8; -99.9 – Hurricane Otis makes landfall with sustained winds of 160 mph (260 km/h) in Acapulco.[nb 5][43]
- 12:00 UTC (7:00 a.m. CDT) at 17.7°N 100.3°W / 17.7; -100.3 – Hurricane Otis weakens to Category 2 strength inland about 60 mi (95 km) north-northwest of Acapulco.[43]
- 18:00 UTC (1:00 p.m. CDT) at 18.6°N 100.7°W / 18.6; -100.7 – Hurricane Otis weakens to tropical storm strength inland about 125 mi (205 km) north-northwest of Acapulco, and soon dissipates.[43]
October 28
- 12:00 UTC (7:00 a.m. CDT) at 10.4°N 92.6°W / 10.4; -92.6 – Tropical Depression Nineteen‑E forms from a wave containing the remnants of Atlantic basin Tropical Depression Twenty-One about 290 mi (465 km) southwest of San Salvador, El Salvador.[45]
October 30
- 00:00 UTC (7:00 p.m. CDT, October 29) at 10.8°N 92.3°W / 10.8; -92.3 – Tropical Depression Nineteen‑E strengthens into Tropical Storm Pilar about 255 mi (405 km) west-southwest of San Salvador.[45]
November
November 1
- 00:00 UTC (7:00 p.m. CDT, October 31) at 11.7°N 89.4°W / 11.7; -89.4 – Tropical Storm Pilar reaches peak intensity with maximum sustained winds of 65 mph (100 km/h) and a minimum central pressure of 995 mbar (29.38 inHg), about 90 mi (150 km) offshore of El Salvador.[45]
November 5
- 18:00 UTC (11:00 a.m. MST) at 10.5°N 113.9°W / 10.5; -113.9 – Tropical Storm Pilar degenerates into a remnant low far southwest of the southern tip of the Baja California peninsula, and subsequently dissipates.[45]
November 21
- 12:00 UTC (4:00 a.m. PST) at 10.1°N 119.8°W / 10.1; -119.8 – Tropical Depression Twenty‑E forms in the west-central eastern Pacific from a monsoon trough disturbance.[46]
November 24
- 12:00 UTC (4:00 a.m. PST) at 13.1°N 122.6°W / 13.1; -122.6 – Tropical Depression Twenty‑E strengthens into Tropical Storm Ramon.[46]
November 25
- 18:00 UTC (10:00 a.m. PST) at 15.0°N 122.9°W / 15.0; -122.9 – Tropical Storm Ramon reaches peak intensity with maximum sustained winds of 45 mph (75 km/h) and a minimum central pressure of 1002 mbar (29.59 inHg),[46] roughly 1,000 mi (1,610 km) west-southwest of the southern tip of the Baja California peninsula.[47]
November 26
- 06:00 UTC (10:00 p.m. PST, November 25) at 14.5°N 123.1°W / 14.5; -123.1 – Tropical Storm Ramon degenerates into a remnant low, and subsequently dissipates.[46]
November 30
- The 2023 Pacific hurricane season officially ends in the Eastern and Central Pacific basins.[3]
- Denotes number of days Hurricane Dora existed in the Eastern and Central Pacific basins, before crossing over into the Western Pacific basin.
- Beatriz formed from the same tropical wave that had previously spawned Atlantic Tropical Storm Bret.[6]
- Due to the threat the developing system posed to southwestern Mexico, the National Hurricane Center initiated advisories on it, designating it Potential Tropical Cyclone Two-E at 03:00 UTC on June 29.[7]
- Due to the threat the developing system posed to southern Mexico, the National Hurricane Center initiated advisories on it, designating it Potential Tropical Cyclone Sixteen-E at 03:00 UTC on October 8.[39]
- O'Leary, Maureen (November 28, 2023). "2023 Atlantic hurricane season ranks 4th for most-named storms in a year". National Oceanic and Atmospheric Administration. Retrieved November 29, 2023.
- 2023 Hurricane Season Summary for the Central Pacific Basin (PDF) (Report). NOAA. November 28, 2023. Retrieved November 29, 2023.
- "Hurricanes Frequently Asked Questions". Miami, Florida: Atlantic Oceanographic and Meteorological Laboratory. June 1, 2023. Retrieved June 1, 2023.
- "Understanding the Date/Time Stamps". Miami, Florida: National Hurricane Center. Retrieved July 20, 2022.
- Pasch, Richard (November 30, 2023). Tropical Cyclone Report: Hurricane Adrian (PDF) (Report). Miami, Florida: National Hurricane Center. Retrieved December 3, 2023.
- Blake, Eric (January 18, 2024). Tropical Cyclone Report: Hurricane Beatriz (PDF) (Report). Miami, Florida: National Hurricane Center. Retrieved February 2, 2024.
- Bucci, Lisa; Pasch, Richard (June 28, 2023). Potential Tropical Cyclone Two-E Discussion Number 1 (Report). Miami, Florida: National Hurricane Center. Retrieved June 29, 2023.
- Philippe, Papin (February 28, 2024). Tropical Cyclone Report: Hurricane Calvin (PDF) (Report). Miami, Florida: National Hurricane Center. Retrieved March 12, 2024.
- Berg, Robbie (August 11, 2023). Tropical Cyclone Report: Tropical Depression Four-E (PDF) (Report). Miami, Florida: National Hurricane Center. Retrieved August 23, 2023.
- Bucci, Lisa (March 5, 2024). Tropical Cyclone Report: Hurricane Dora (PDF) (Report). Miami, Florida: National Hurricane Center. Retrieved March 12, 2024.
- Pasch, Richard (August 1, 2023). Tropical Storm Dora Advisory Number 3 (Report). Miami, Florida: National Hurricane Center. Retrieved August 1, 2023.
- Kelly, Larry; Blake, Eric (August 1, 2023). Hurricane Dora Advisory Number 6 (Report). Miami, Florida: National Hurricane Center. Retrieved August 2, 2023.
- Papin, Philippe (August 2, 2023). Hurricane Dora Advisory Number 8 (Report). Miami, Florida: National Hurricane Center. Retrieved August 2, 2023.
- Reinhart, Brad (August 2, 2023). Hurricane Dora Advisory Number 10 (Report). Miami, Florida: National Hurricane Center. Retrieved August 3, 2023.
- Bucci, Lisa (August 2, 2023). Hurricane Dora Advisory Number 11 (Report). Miami, Florida: National Hurricane Center. Retrieved August 3, 2023.
- Beven, Jack (August 3, 2023). Hurricane Dora Advisory Number 12 (Report). Miami, Florida: National Hurricane Center. Retrieved August 3, 2023.
- Berg, Robbie (August 3, 2023). Hurricane Dora Tropical Cyclone Update (Report). Miami, Florida: National Hurricane Center. Retrieved August 7, 2023.
- Beven, Jack (August 4, 2023). Hurricane Dora Advisory Number 16 (Report). Miami, Florida: National Hurricane Center. Retrieved August 4, 2023.
- Beven, Jack (August 4, 2023). Hurricane Dora Advisory Number 17 (Report). Miami, Florida: National Hurricane Center. Retrieved August 4, 2023.
- Kelly, Larry (November 14, 2023). Tropical Cyclone Report: Tropical Storm Eugene (PDF) (Report). Miami, Florida: National Hurricane Center. Retrieved November 18, 2023.
- Beven, Jack (August 5, 2023). Hurricane Dora Advisory Number 20 (Report). Miami, Florida: National Hurricane Center. Retrieved August 5, 2023.
- Beven, Jack (August 5, 2023). Hurricane Dora Advisory Number 22 (Report). Miami, Florida: National Hurricane Center. Retrieved August 5, 2023.
- Berg, Robbie (August 5, 2023). Hurricane Dora Advisory Number 23 (Report). Miami, Florida: National Hurricane Center. Retrieved August 7, 2023.
- Zelinsky, David (August 6, 2023). Hurricane Dora Advisory Number 25 (Report). Miami, Florida: National Hurricane Center. Retrieved August 6, 2023.
- 2023 Hurricane Season Summary for the Central Pacific Basin (PDF) (Report). Honolulu, Hawaii: Central Pacific Hurricane Center. November 28, 2023. Retrieved March 26, 2024.
- Prognostic Reasoning for Typhoon 05E (Dora) Warning No. 47 (Report). Honolulu, Hawaii: United States Joint Typhoon Warning Center. August 12, 2023. Archived from the original on August 12, 2023. Retrieved August 12, 2023.
- Berg, Robbie (November 15, 2023). Tropical Cyclone Report: Hurricane Fernanda (PDF) (Report). Miami, Florida: National Hurricane Center. Retrieved November 21, 2023.
- Kelly, Larry (November 8, 2023). Tropical Cyclone Report: Tropical Storm Greg (PDF) (Report). Miami, Florida: National Hurricane Center. Retrieved November 8, 2023.
- Rinehart, Brad (February 12, 2024). Tropical Cyclone Report: Hurricane Hilary (PDF) (Report). Miami, Florida: National Hurricane Center. Retrieved February 24, 2024.
- Cangialosi, John (August 18, 2023). Hurricane Hilary Advisory Number 9A (Report). Miami, Florida: National Hurricane Center. Retrieved February 24, 2024.
- Cangialosi, John (August 19, 2023). Hurricane Hilary Advisory Number 13A (Report). Miami, Florida: National Hurricane Center. Retrieved February 24, 2024.
- Blake, Eric (February 15, 2024). Tropical Cyclone Report: Tropical Storm Irwin (PDF) (Report). Miami, Florida: National Hurricane Center. Retrieved February 24, 2024.
- Bucci, Lisa (February 1, 2024). Tropical Cyclone Report: Hurricane Jova (PDF) (Report). Miami, Florida: National Hurricane Center. Retrieved February 8, 2024.
- Pasch, Richard (September 5, 2023). Tropical Storm Jova Advisory Number 3 (Report). Miami, Florida: National Hurricane Center. Retrieved September 5, 2023.
- Brown, Daniel; Wroe, Derek (November 28, 2023). Tropical Cyclone Report: Tropical Depression Twelve-E (PDF) (Report). Miami, Florida: National Hurricane Center. Retrieved November 28, 2023.
- Papin, Philippe (December 8, 2023). Tropical Cyclone Report: Tropical Storm Kenneth (PDF) (Report). Miami, Florida: National Hurricane Center. Retrieved December 9, 2023.
- Pasch, Richard (January 31, 2024). Tropical Cyclone Report: Tropical Depression Fourteen-E (PDF) (Report). Miami, Florida: National Hurricane Center. Retrieved February 2, 2023.
- Pasch, Richard (March 15, 2024). Tropical Cyclone Report: Hurricane Lidia (PDF) (Report). Miami, Florida: National Hurricane Center. Retrieved March 17, 2024.
- Brown, Daniel (October 7, 2023). Potential Tropical Cyclone Sixteen-E Advisory Number 1 (Report). Miami, Florida: National Hurricane Center. Retrieved October 8, 2023.
- Berg, Robbie (January 11, 2024). Tropical Cyclone Report: Tropical Storm Max (PDF) (Report). Miami, Florida: National Hurricane Center. Retrieved February 3, 2024.
- Reinhart, Brad (October 11, 2023). Tropical Storm Lidia Intermediate Advisory Number 32A (Report). Miami, Florida: National Hurricane Center. Retrieved October 14, 2023.
- Bucci, Lisa (March 15, 2024). Tropical Cyclone Report: Hurricane Norma (PDF) (Report). Miami, Florida: National Hurricane Center. Retrieved March 17, 2024.
- Reinhart, Brad; Reinhart, Amanda (March 7, 2024). Tropical Cyclone Report: Hurricane Otis (PDF) (Report). Miami, Florida: National Hurricane Center. Retrieved March 17, 2024.
- Mayes-Osterman, Cybele; Pulver, Dinah Voyles (October 25, 2023). "Hurricane Otis strikes Acapulco as strongest storm to hit Mexico on record". USA Today. Retrieved October 25, 2023.
- Blake, Eric (March 8, 2024). Tropical Cyclone Report: Tropical Storm Pilar (PDF) (Report). Miami, Florida: National Hurricane Center. Retrieved March 8, 2024.
- Berg, Robbie (January 18, 2024). Tropical Cyclone Report: Tropical Storm Ramon (PDF) (Report). Miami, Florida: National Hurricane Center. Retrieved February 2, 2023.
- Kelly, Larry (November 25, 2023). Tropical Storm Ramon Advisory Number 9 (Report). Miami, Florida: National Hurricane Center. Retrieved February 2, 2024.
- 2023 Tropical Cyclone Advisory Archive, National Hurricane Center and Central Pacific Hurricane Center, noaa.gov