S_and_P_500_daily_linear_chart_1950_to_2016.png

Size of this preview:
800 × 540 pixels
.
Other resolutions:
320 × 216 pixels
|
640 × 432 pixels
|
1,024 × 691 pixels
|
1,177 × 794 pixels
.
Summary
| Description |
English:
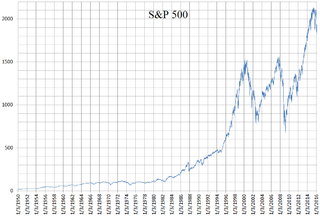
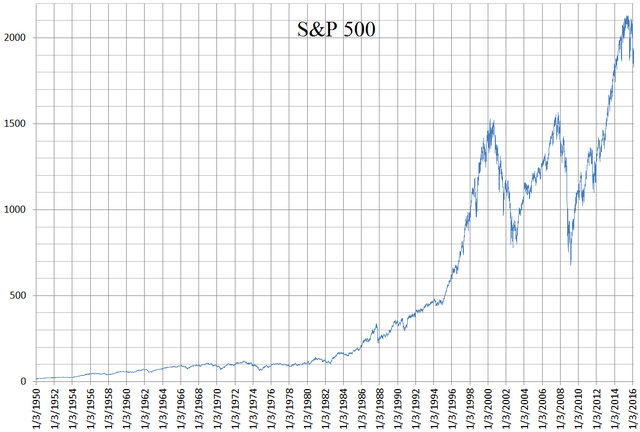
A linear chart of the S&P 500 using closing values from January 3rd, 1950 to February 19th, 2016
|
| Date | |
| Source | Own work |
| Author | Overjive |
Used data from Yahoo Finance and made the graph using Excel
Licensing
I, the copyright holder of this work, hereby publish it under the following license:
This file is licensed under the
Creative Commons
Attribution-Share Alike 4.0 International
license.
-
You are free:
- to share – to copy, distribute and transmit the work
- to remix – to adapt the work
-
Under the following conditions:
- attribution – You must give appropriate credit, provide a link to the license, and indicate if changes were made. You may do so in any reasonable manner, but not in any way that suggests the licensor endorses you or your use.
- share alike – If you remix, transform, or build upon the material, you must distribute your contributions under the same or compatible license as the original.