S&P_500_Index_Logarithmic_Chart_through_Jan_2021.svg

Summary
| Description |
English:
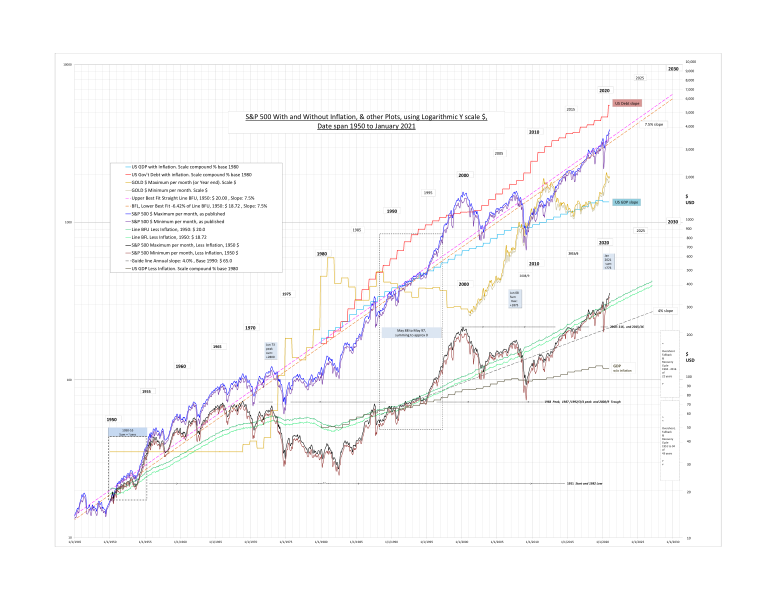
S&P 500 Index Logarithmic Chart's Interesting Features
While S&P 500 data to linear plot scale is good for analysis of a span of 2 or 3 years, beyond that a logarithmic S&P 500 chart is best. This is because it gives the same Y or vertical displacement for a certain percentage move up or down regardless of date. Moreover, a fixed compound interest percentage gain plots as a straight line on a logarithmic chart, which is very useful as the human eye is very good at judging and comparing data positions above and below a straight line (versus the linear plot's exponential curve for same).
Logarithmic Chart's Interesting Interpretations Firstly the upper cluster S&P 500 plots including inflation follow a straight line percentage gain much better than those without; therefore inflation somehow evens out the ups (over-performance) and downs (under-performance) of the S&P 500 without inflation.It is interesting to note that the 1955-69 post-war overshoot versus the 7.5% straight line, is eventually negated by a 1974-86 undershoot period below the straight line, returning to the 7.5% line in the 1987/97 region. Also, the Internet Bubble from 1995, peaking way-above the 7.5% line at 2000, is followed by drops, 2002 and especially 2009 below the straight line, returning to the 7.5% line in 2015/6. Interestingly, the WITHOUT inflation S&P 500 plot best shows index cycles. 1951 to 1994 was 43 years of boom-overshoot, then fallback, and then recovery back to the overshoot peak. Another index cycle of 22 years 1994 to 2016 is shown: 1994 to 2000 boom overshoot-peak, fall back to 2009, then recovery back to the overshoot peak in 2015/6. A new cycle may have started in 2015/6. The Best Fit straight line is thought to be a very approximate indication of an S&P 500 par slope, shown to indicate whether an index value is above or below the derived slope norm. Owing to the only 70 years of financial data, and the unique technology advances and inflation profile contributing to it, it is not certain whether a 7.5% Straight Line, or for that matter any Straight Line will be maintained in the future. Interestingly, the US National Debt % slope somewhat matches the overall S&P 500 % slope. Slope increases in Debt seem to precede S&P 500 slope increases by a few years; data from: http://www.treasurydirect.gov/govt/reports/pd/histdebt/histdebt_histo5.htm The GDP graph % slope underperforms the S&P 500 % slope; data from: http://www.bea.gov/national/index.htm#gdp Gold in $ per ounce is added so its unusual % slope can also be compared; data from: https://www.usagold.com/reference/prices/goldhistory.php |
| Date | |
| Source | Own work |
| Author | Richardhy |
Licensing
-
You are free:
- to share – to copy, distribute and transmit the work
- to remix – to adapt the work
-
Under the following conditions:
- attribution – You must give appropriate credit, provide a link to the license, and indicate if changes were made. You may do so in any reasonable manner, but not in any way that suggests the licensor endorses you or your use.
- share alike – If you remix, transform, or build upon the material, you must distribute your contributions under the same or compatible license as the original.