Modulated_radio_signal_frequency_spectrum.svg

Size of this PNG preview of this SVG file:
437 × 284 pixels
.
Other resolutions:
320 × 208 pixels
|
640 × 416 pixels
|
1,024 × 665 pixels
|
1,280 × 832 pixels
|
2,560 × 1,664 pixels
.
Summary
| Description |
English:
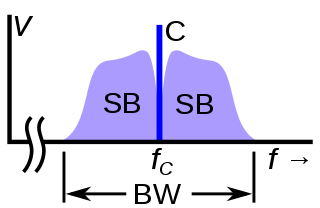
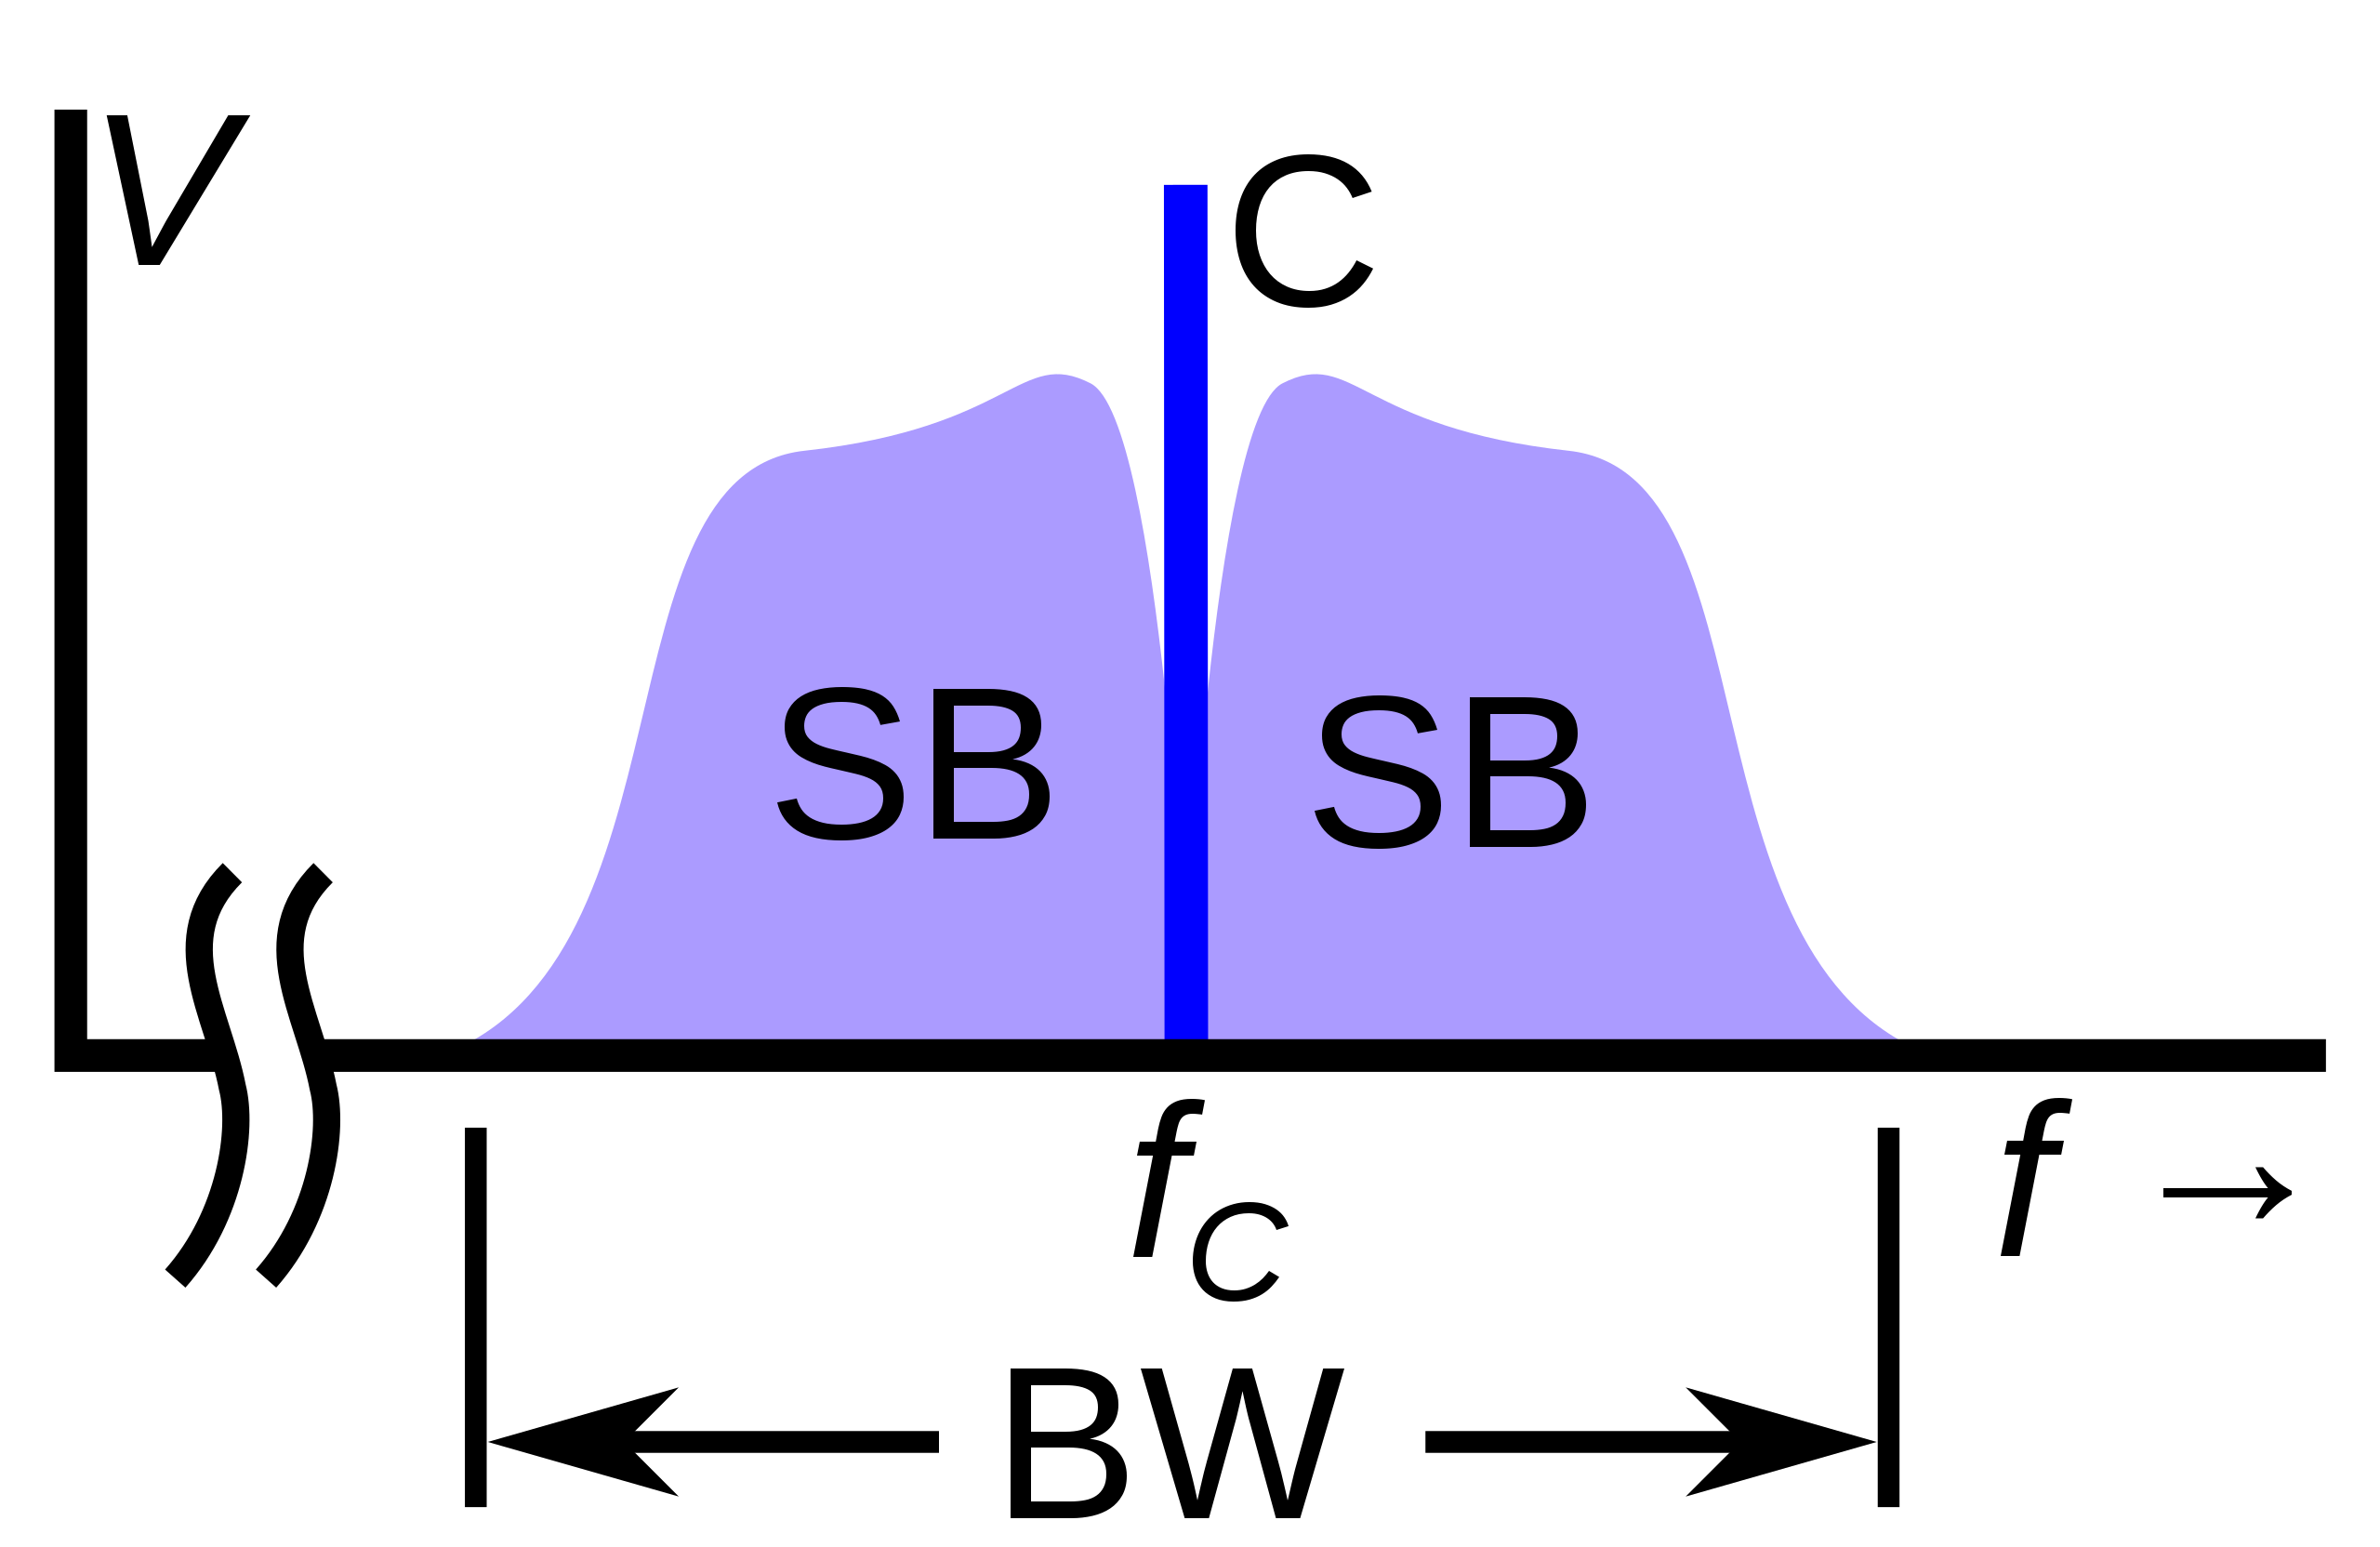
The
frequency spectrum
of a typical AM or FM modulated radio signal, as it would be seen on a
spectrum analyzer
. The vertical axis is signal strength or voltage, the horizontal axis is frequency. It consists of a strong
carrier wave
(C) at the frequency
f
C
of the radio transmitter. The information (
modulation
) carried by the signal is contained in two narrow frequency bands above and below the carrier frequency, called
sidebands
(SB). The sidebands are symmetrical about the carrier. In an audio radio broadcast the sidebands carry the
audio signal
that represents the sound waves. The portions of the sidebands close to the carrier contain the low audio frequencies, while the portions further from the carrier contain the high audio frequencies. Therefore the sidebands tend to fall off farther from the carrier, and also close to the carrier at points which represent bass frequencies below 20 Hz, the lower human hearing limit.
|
| Date | |
| Source | Own work |
| Author | Chetvorno |
| SVG development |
This diagram was created with
Inkscape
, or with something else
.
This diagram uses
translateable
embedded
text.
|
Licensing
I, the copyright holder of this work, hereby publish it under the following license:
|
|
This file is made available under the Creative Commons CC0 1.0 Universal Public Domain Dedication . |
|
The person who associated a work with this deed has dedicated the work to the
public domain
by waiving all of their rights to the work worldwide under copyright law, including all related and neighboring rights, to the extent allowed by law. You can copy, modify, distribute and perform the work, even for commercial purposes, all without asking permission.
|